MA Weekly Technical Analysis
Mastercard Inc
A global financial services company that provides a wide range of payment choices and processes transactions for credit and debit cards, electronic cash, and ATMs.
MA Technical Analysis Summary
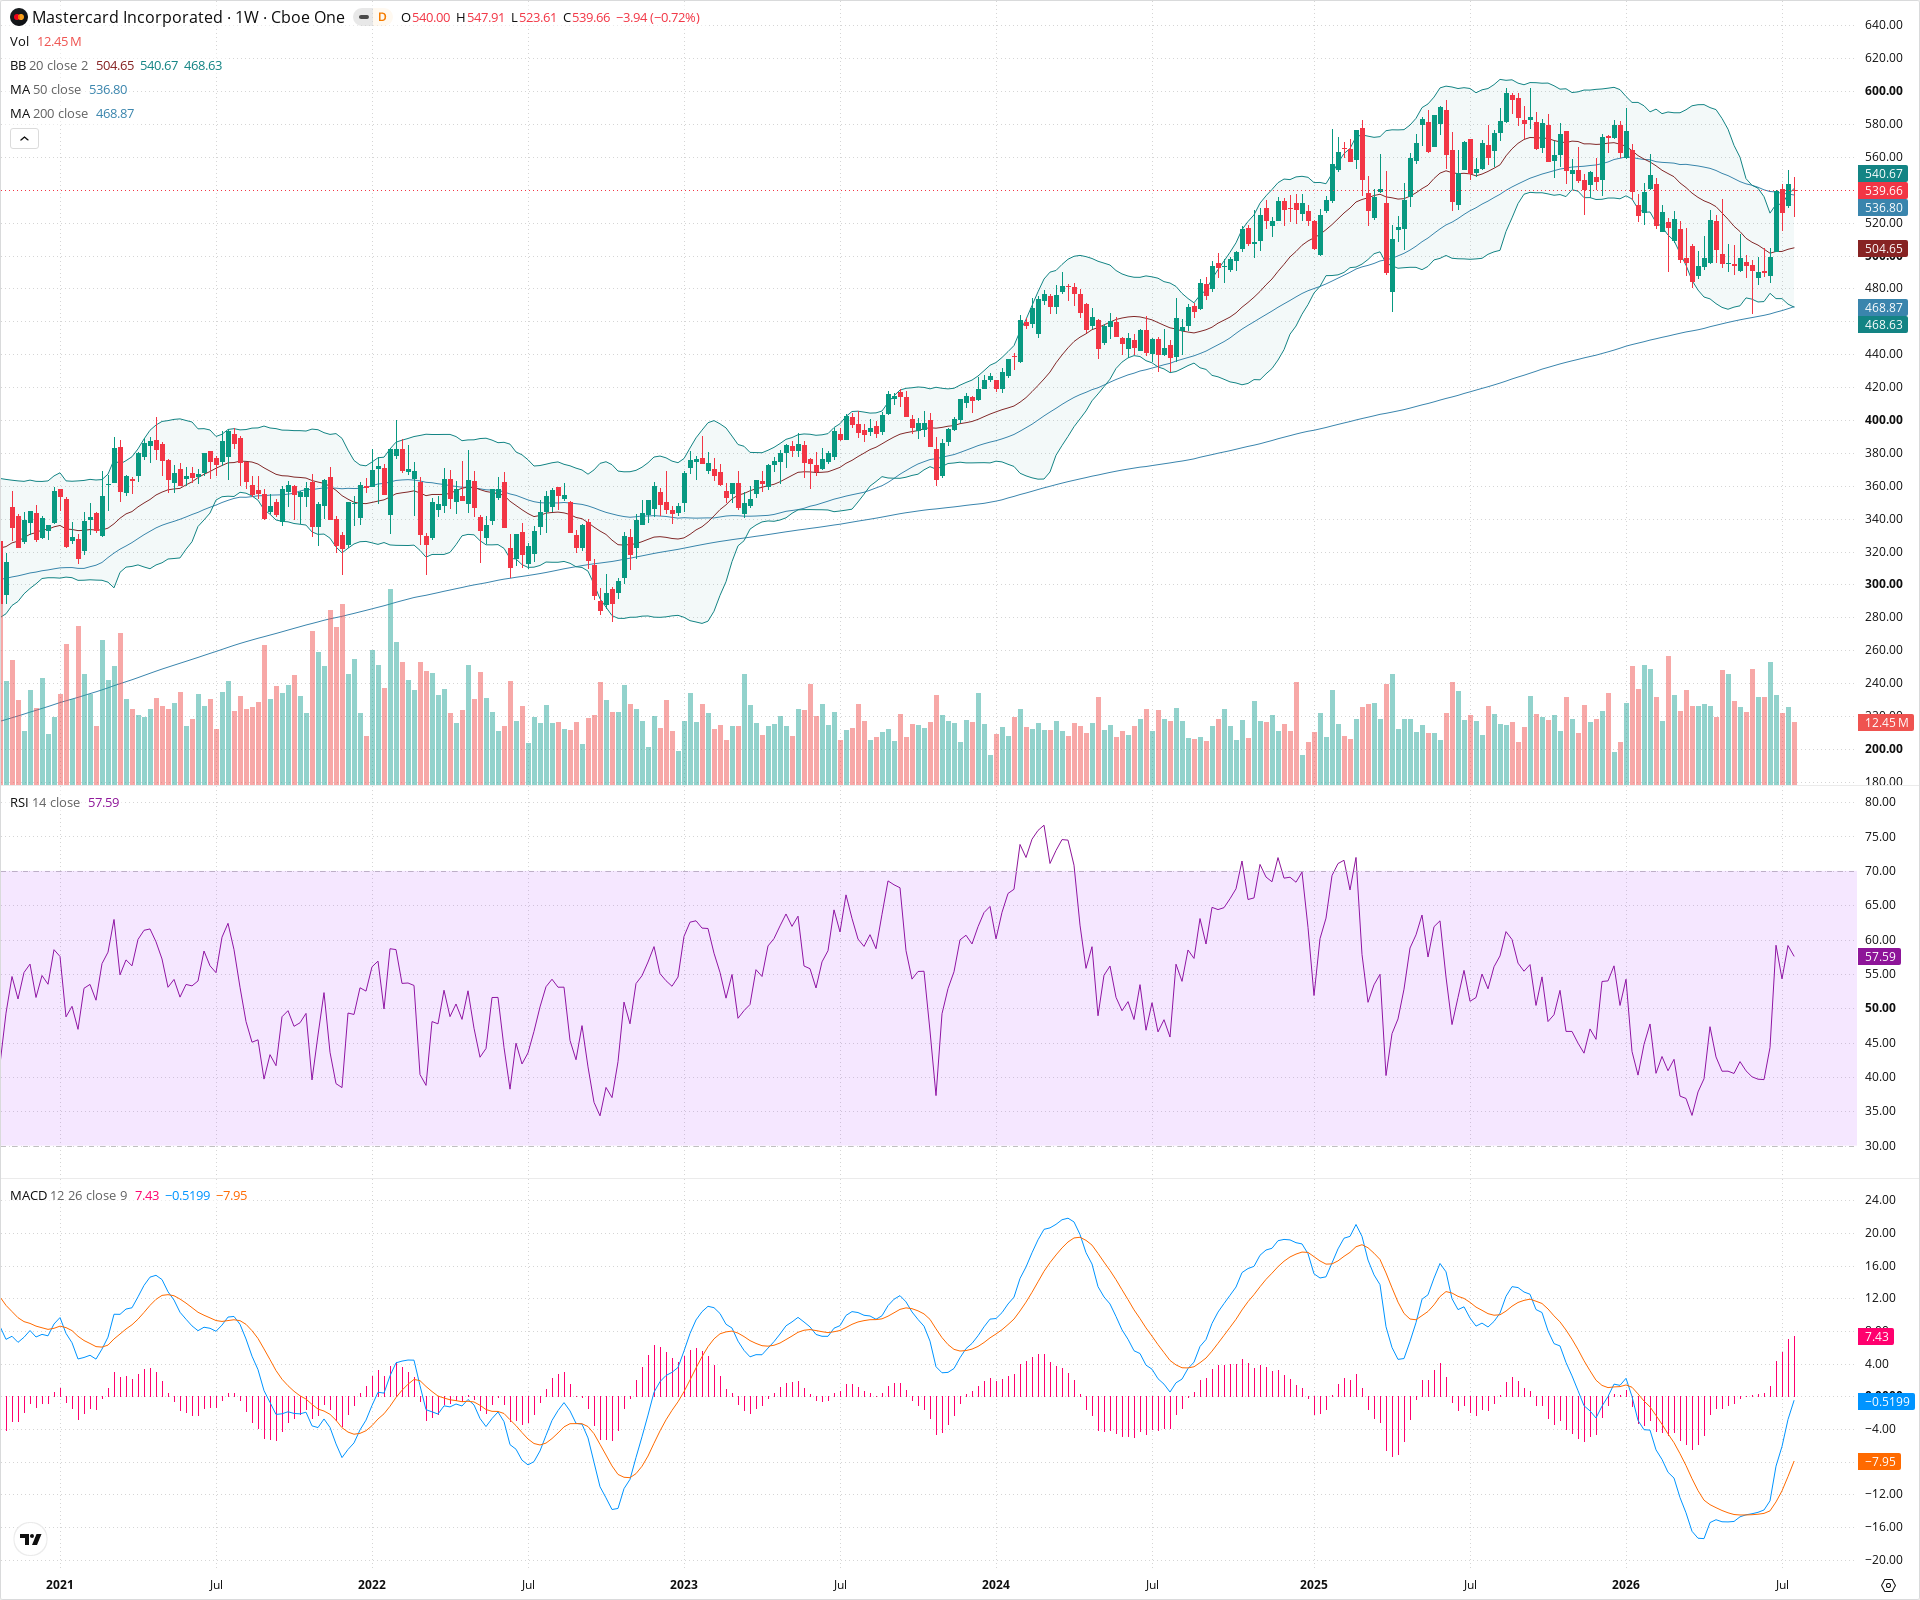
The technical posture for this asset remains firmly bullish on a long-term basis, underpinned by a persistent uptrend above a rising 200-week SMA. Recently, the asset experienced a sharp corrective pullback but executed a strong V-shaped recovery to reclaim the 50-week SMA. Short-term momentum indicators like RSI and the MACD histogram have flipped positive, suggesting the correction may be over and the primary uptrend is poised to resume towards prior highs.
Included In Lists
Related Tickers of Interest
MA Weekly Chart
Sentiment
Short-term Sentiment (days to weeks): Bullish
Price has aggressively rebounded from a sharp pullback, reclaiming the 50-week SMA. RSI has crossed back above 50, and the MACD histogram has turned strongly positive, indicating a shift back to bullish momentum.
Long-term Sentiment (weeks to months): Bullish
The chart displays a clear, multi-year sequence of higher highs and higher lows. The price remains comfortably above a rising 200-week SMA, confirming the structural long-term uptrend remains intact.
Report Metadata
- Timeframe: weekly
- Generated at: 2026-07-25T09:03:22.603Z
- Model: gemini-3.1-pro-preview
Support Price Levels
| Level | Range | Strength | Notes |
|---|---|---|---|
| $487.50 | $480.00 - $495.00 | Strong | Recent major swing low area that saw significant buying pressure and a sharp rejection of lower prices. |
| $470.00 | $465.00 - $475.00 | Strong | Dynamic support zone defined by the rising 200-week SMA. |
Resistance Price Levels
| Level | Range | Strength | Notes |
|---|---|---|---|
| $557.50 | $550.00 - $565.00 | Weak | Immediate overhead resistance zone where price previously consolidated before breaking down; also aligns near the upper Bollinger Band. |
| $590.00 | $580.00 - $600.00 | Strong | Zone encompassing the prior major swing highs and structural peaks before the recent correction. |
Potential Chart Patterns in Formation
| Strength | Pattern | Signal | Target | Details |
|---|---|---|---|---|
| Strong | V-Shaped Recovery / False Breakdown | Bullish | N/A | Price broke sharply below the 50-week SMA but immediately reversed, creating a deep 'V' shape and trapping bearish momentum, suggesting strong underlying demand. |
Frequently Asked Questions about MA
What is the current sentiment for MA?
The short-term sentiment for MA is currently Bullish because Price has aggressively rebounded from a sharp pullback, reclaiming the 50-week SMA. RSI has crossed back above 50, and the MACD histogram has turned strongly positive, indicating a shift back to bullish momentum.. The long-term trend is classified as Bullish.
What are the key support levels for MA?
StockDips.AI has identified key support levels for MA at $487.50 and $470.00. These levels may represent potential accumulation zones where buying interest could emerge.
Is MA in a significant dip or a Value Dip right now?
MA has a Value Score of 64/100. It is not currently flagged as a significant dip in the Top Dips list. It is not listed as a Value Dip because the long-term sentiment or value-score threshold does not qualify.
View the full interactive analysis on StockDips.AI.