MA Monthly Technical Analysis
Mastercard Inc
A global financial services company that provides a wide range of payment choices and processes transactions for credit and debit cards, electronic cash, and ATMs.
MA Technical Analysis Summary
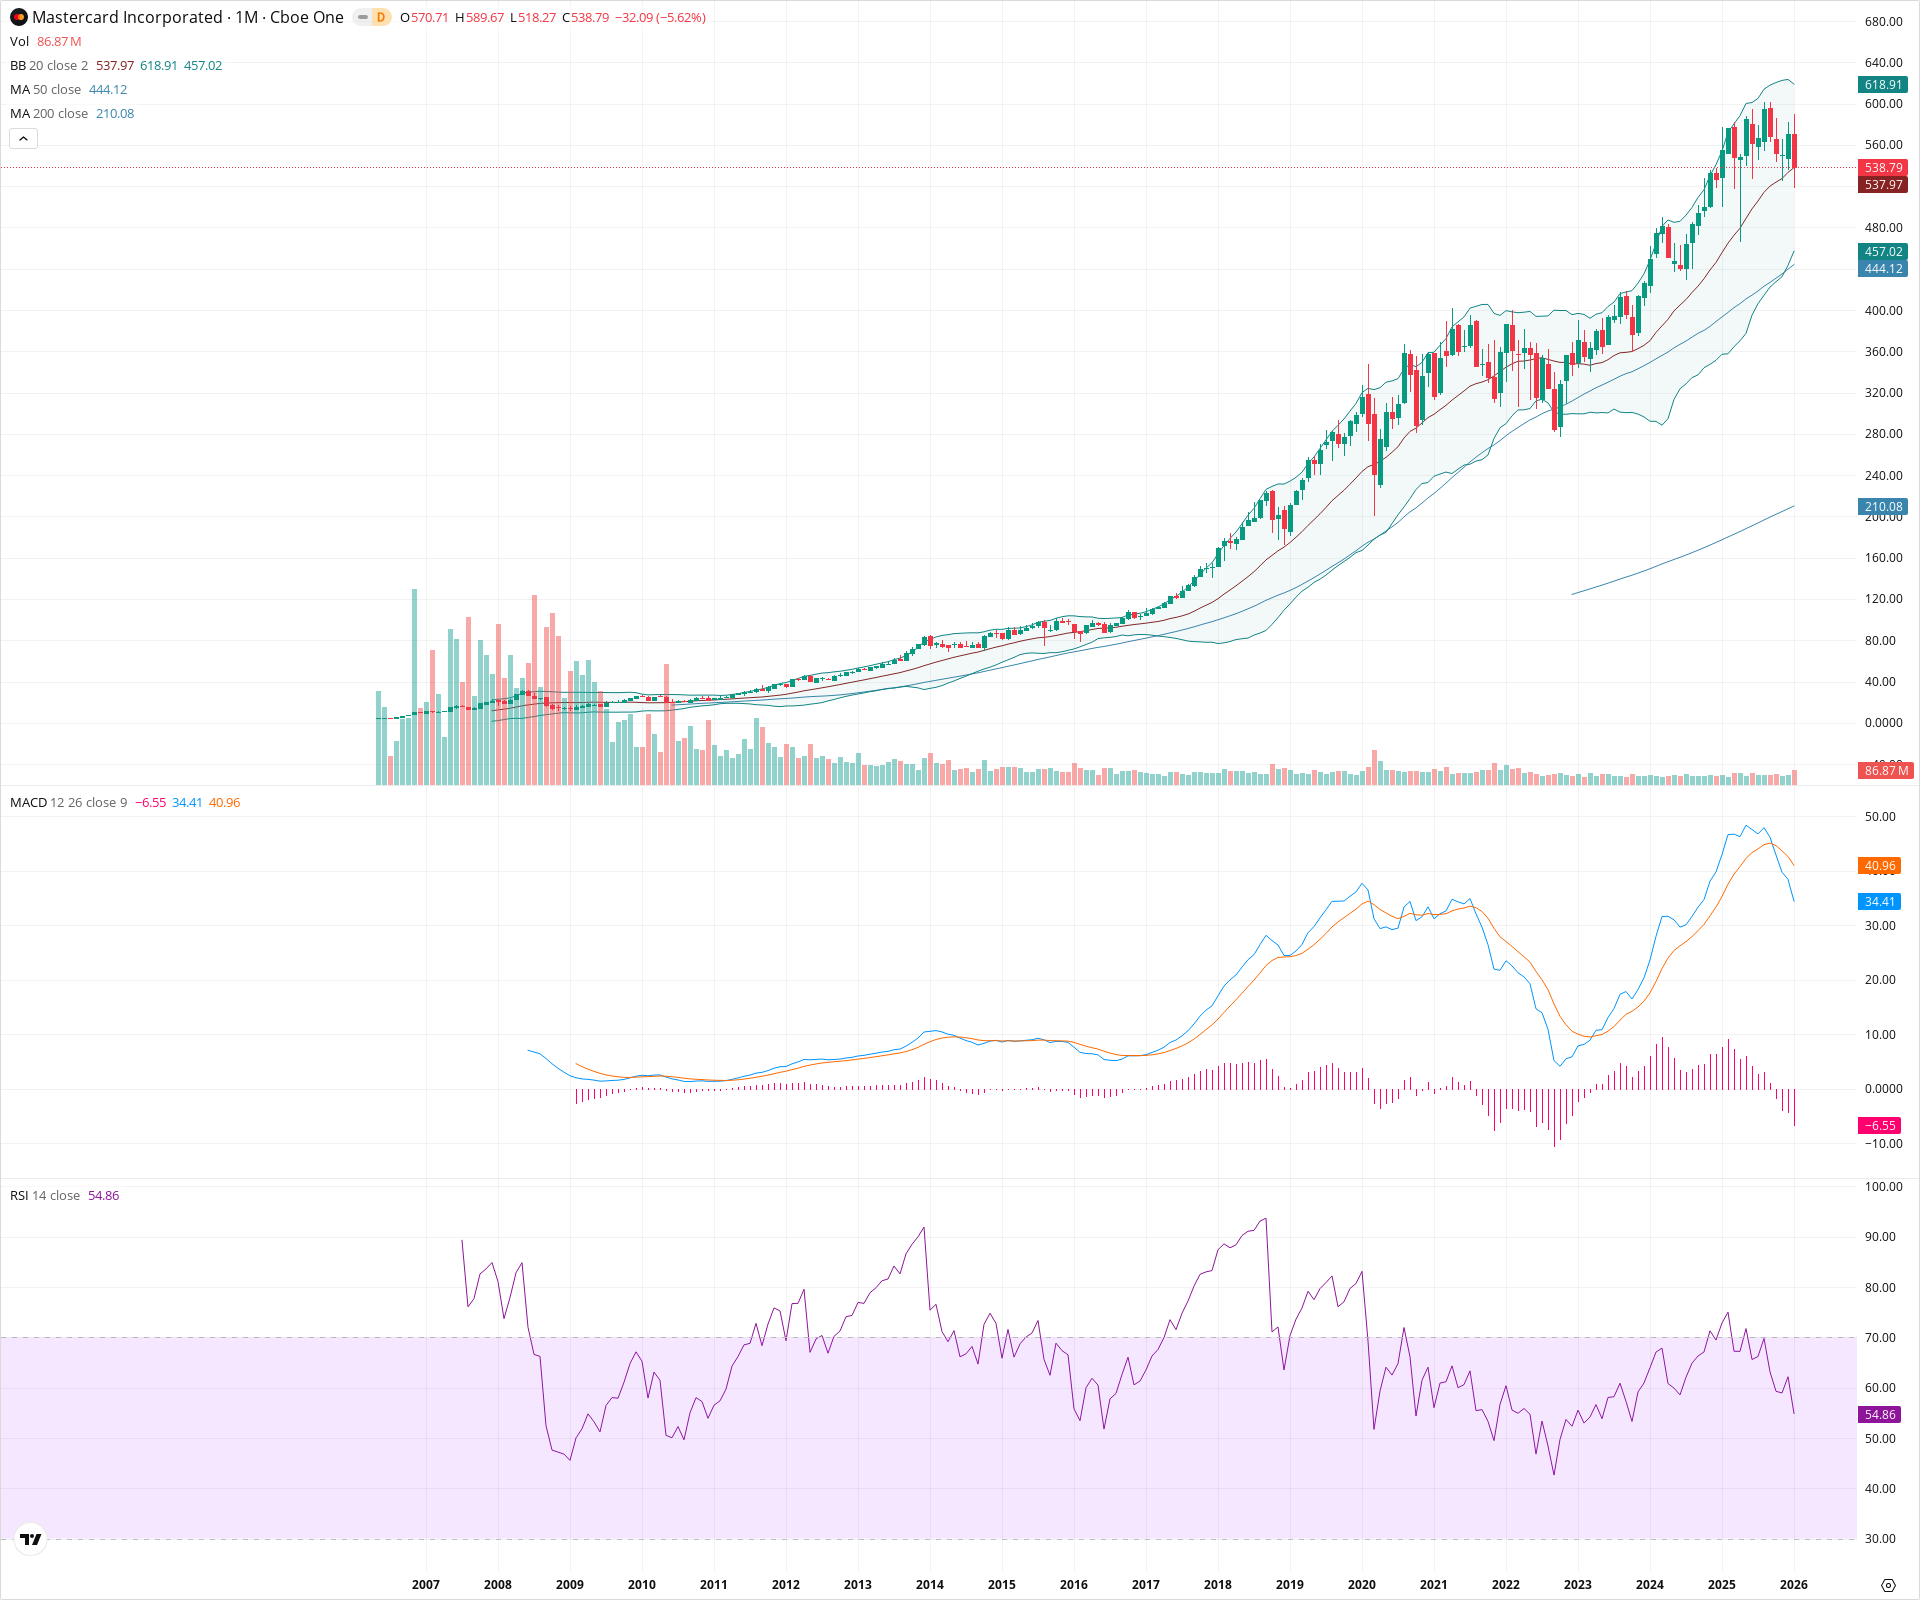
Mastercard exhibits a robust long-term bullish structure, trading significantly above its key secular moving averages (50 and 200 SMAs). However, the immediate technical picture warns of a consolidation or correction phase, driven by a confirmed bearish MACD crossover and a sharp rejection from all-time highs. Investors should watch the 20-month SMA closely; a monthly close below this level suggests a deeper pullback toward the mid-400s support zone is likely.
Included In Lists
Related Tickers of Interest
MA Monthly Chart
Sentiment
Short-term Sentiment (days to weeks): Bearish
The monthly MACD has executed a bearish crossover at a high level, and the current monthly candle is a large red bar erasing the previous month's gains, indicating a sharp shift in immediate momentum.
Long-term Sentiment (weeks to months): Bullish
The stock remains in a clearly defined secular uptrend, trading well above the rising 50-month and 200-month SMAs, with the long-term structure of higher highs and higher lows fully intact.
Report Metadata
- Timeframe: monthly
- Generated at: 2026-02-02T06:45:32.712Z
- Model: gemini-3-pro-preview
Support Price Levels
| Level | Range | Strength | Notes |
|---|---|---|---|
| $538.00 | $537.00 - $539.00 | Weak | Immediate dynamic support provided by the 20-month SMA (Bollinger Band basis); price is currently sitting exactly on this level under heavy selling pressure. |
| $457.50 | $455.00 - $460.00 | Strong | Confluence of the lower Bollinger Band and structural support from the consolidation low established in early 2024. |
| $397.50 | $390.00 - $405.00 | Strong | Major historical support zone corresponding to the top of the multi-year consolidation base (2021-2023) that acted as resistance before the breakout. |
Resistance Price Levels
| Level | Range | Strength | Notes |
|---|---|---|---|
| $589.50 | $589.00 - $590.00 | Strong | The current all-time high and the peak of the recent rally, serving as the primary ceiling for price action. |
Potential Chart Patterns in Formation
| Strength | Pattern | Signal | Target | Details |
|---|---|---|---|---|
| Strong | Secular Bull Channel | Bullish | N/A | A long-term ascending channel characterized by consistent higher highs and higher lows over the past decade, supported by the 50-month SMA. |
| Strong | Bearish Momentum Divergence | Bearish | N/A | While price made new highs, the MACD histogram has been contracting and has now crossed into negative territory (bearish crossover), signaling waning trend strength. |
Frequently Asked Questions about MA
What is the current sentiment for MA?
The short-term sentiment for MA is currently Bearish because The monthly MACD has executed a bearish crossover at a high level, and the current monthly candle is a large red bar erasing the previous month's gains, indicating a sharp shift in immediate momentum.. The long-term trend is classified as Bullish.
What are the key support levels for MA?
StockDips.AI has identified key support levels for MA at $538.00 and $457.50. These levels may represent potential accumulation zones where buying interest could emerge.
Is MA in a significant dip or a Value Dip right now?
MA has a Value Score of 64/100. It is not currently flagged as a significant dip in the Top Dips list. It is not listed as a Value Dip because the long-term sentiment or value-score threshold does not qualify.
View the full interactive analysis on StockDips.AI.