SOL Weekly Technical Analysis
Solana
High-performance blockchain supporting fast and inexpensive decentralized apps and NFTs.
SOL Technical Analysis Summary
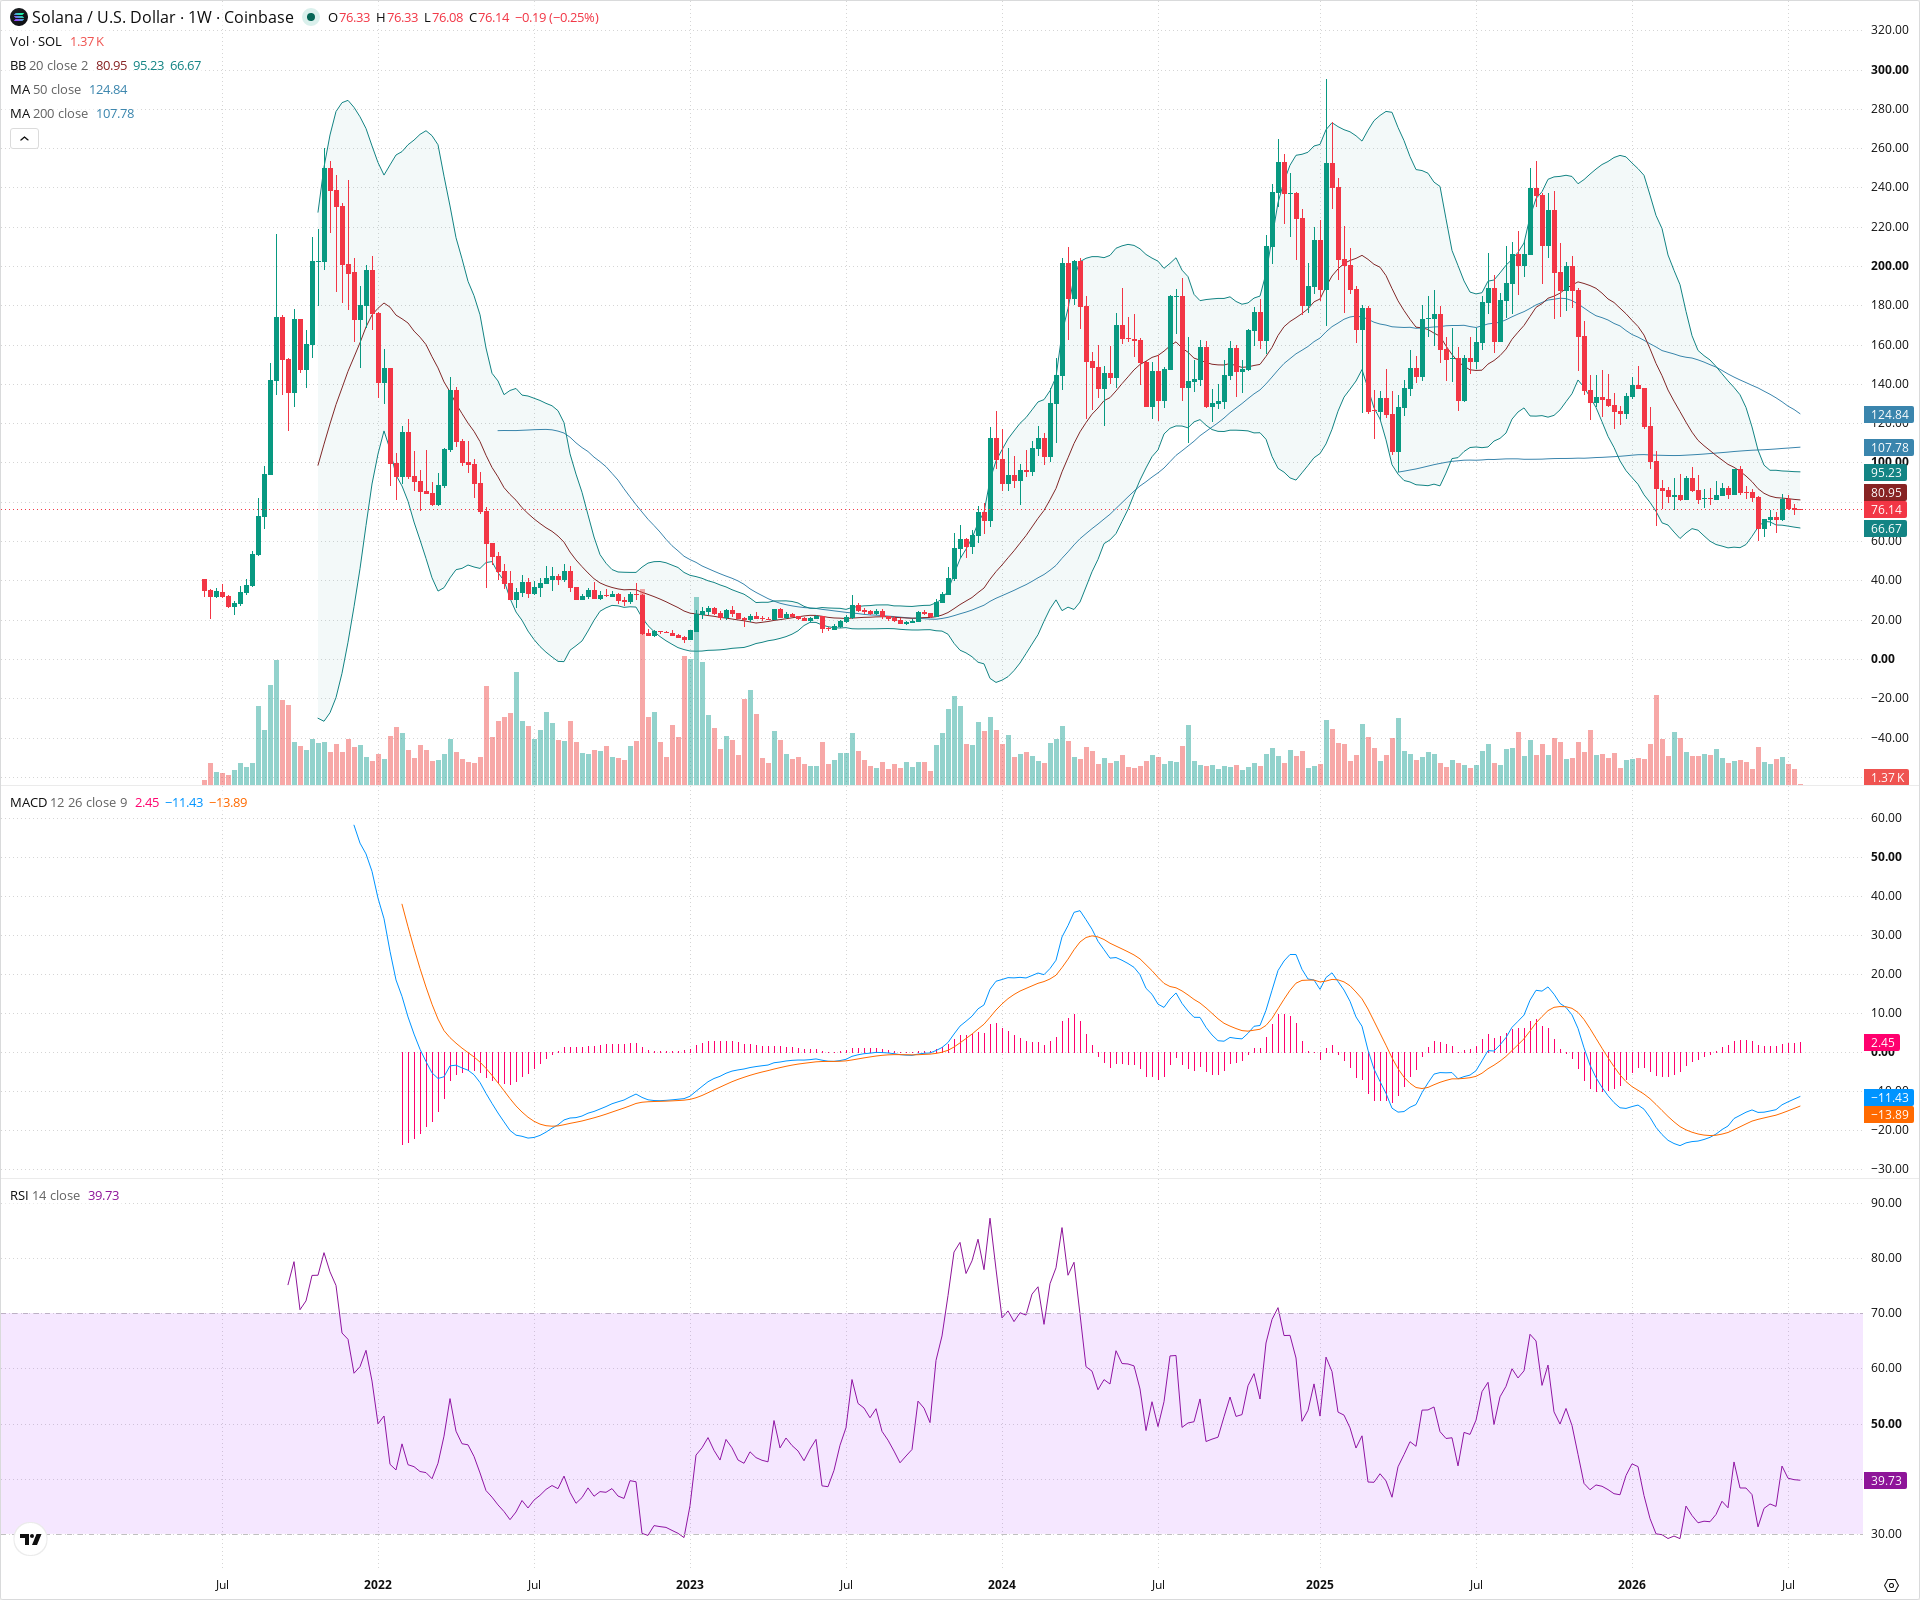
The weekly technical picture for SOL is heavily bearish across multiple timeframes. Following a failure to set a new high, the asset has entered a severe multi-month downtrend, breaking decisively below critical long-term support levels including the 200-week SMA. With momentum indicators like MACD continuing to point downwards and price structure offering little sign of near-term reversal, the primary focus is on lower structural support zones around $60-$65.
Included In Lists
Related Tickers of Interest
SOL Weekly Chart
Sentiment
Short-term Sentiment (days to weeks): Bearish
Price is locked in a pronounced downtrend, making consistent lower highs and lower lows while riding the lower Bollinger Band. It is trading well below the sharply declining 20-week SMA, with negative MACD momentum and RSI heading toward oversold territory.
Long-term Sentiment (weeks to months): Bearish
The chart displays a massive macro lower high structure peaking around 210-220, followed by a decisive breakdown. Price has now lost the support of the 200-week SMA and the 50-week SMA is rolling over, indicating a resumption or continuation of a broader long-term downtrend.
Report Metadata
- Timeframe: weekly
- Generated at: 2026-07-20T00:03:08.350Z
- Model: gemini-3.1-pro-preview
Support Price Levels
| Level | Range | Strength | Notes |
|---|---|---|---|
| $62.50 | $60.00 - $65.00 | Strong | Key structural support zone established by significant consolidation and previous resistance prior to the major upward rally. |
| $20.00 | $15.00 - $25.00 | Strong | Major historical accumulation base and macro cycle bottom. |
Resistance Price Levels
| Level | Range | Strength | Notes |
|---|---|---|---|
| $82.50 | $80.00 - $85.00 | Strong | Immediate resistance aligning with the declining 20-week SMA and recent lower highs. |
| $125.00 | $120.00 - $130.00 | Strong | Major structural resistance zone, representing previous critical support that was broken, now converging with the declining 50-week SMA. |
Potential Chart Patterns in Formation
| Strength | Pattern | Signal | Target | Details |
|---|---|---|---|---|
| Strong | Macro Lower High Structure | Bearish | N/A | After a massive rally, price formed a significant peak well below its all-time high, followed by a sustained breakdown below key long-term moving averages, confirming a major shift in trend. |
| Strong | Multi-month Downtrend | Bearish | N/A | A clear pattern of lower highs and lower lows defined by rejection at the 20-week SMA, indicating sustained selling pressure over several months. |
Frequently Asked Questions about SOL
What is the current sentiment for SOL?
The short-term sentiment for SOL is currently Bearish because Price is locked in a pronounced downtrend, making consistent lower highs and lower lows while riding the lower Bollinger Band. It is trading well below the sharply declining 20-week SMA, with negative MACD momentum and RSI heading toward oversold territory.. The long-term trend is classified as Bearish.
What are the key support levels for SOL?
StockDips.AI has identified key support levels for SOL at $62.50 and $20.00. These levels may represent potential accumulation zones where buying interest could emerge.
Is SOL in a significant dip or a Value Dip right now?
SOL has a Value Score of 66/100. It is not currently flagged as a significant dip in the Top Dips list. It is not listed as a Value Dip because the long-term sentiment or value-score threshold does not qualify.
View the full interactive analysis on StockDips.AI.