SOL Monthly Technical Analysis
Solana
High-performance blockchain supporting fast and inexpensive decentralized apps and NFTs.
SOL Technical Analysis Summary
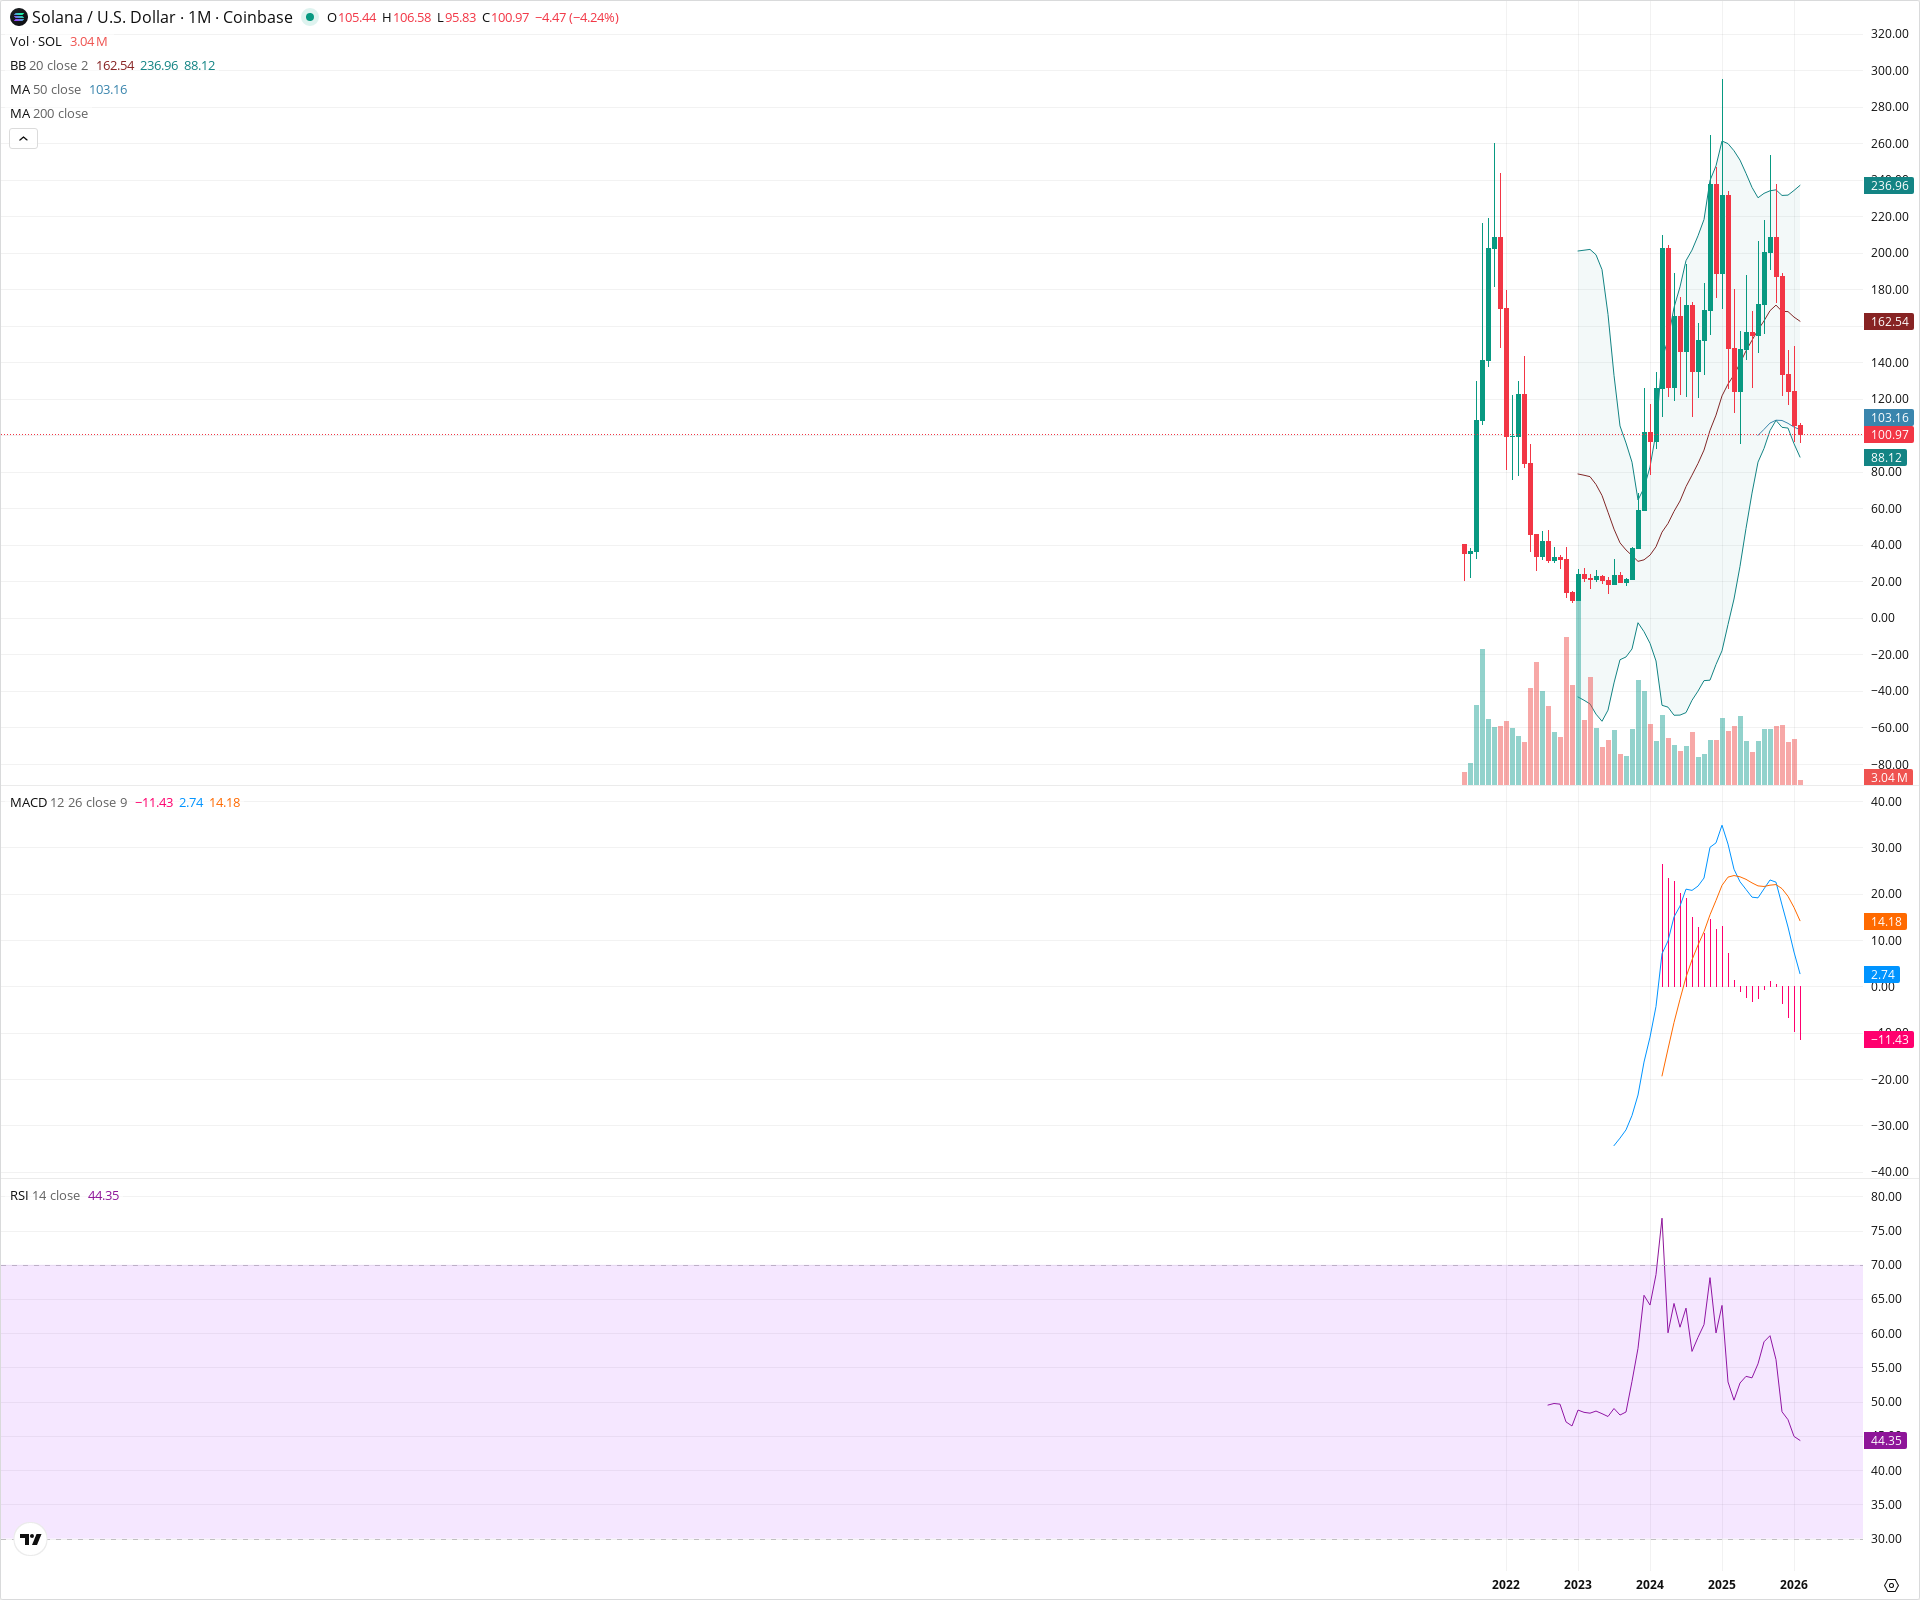
Solana is currently in a steep correction phase on the monthly chart, having retraced approximately 50% from its recent local highs to test the critical 50-month SMA near $100. Technical damage is evident with a bearish MACD crossover and a loss of the 20-month SMA, indicating strong downward momentum in the medium term. Investors should watch the $80-$100 zone closely; holding this level is essential to maintain the structure of the broader recovery from 2022 lows. A failure here could signal a retest of much lower structural bases.
Included In Lists
Related Tickers of Interest
SOL Monthly Chart
Sentiment
Short-term Sentiment (days to weeks): Bearish
Price has lost the 20-month SMA and is piercing the 50-month SMA, confirmed by a bearish MACD crossover and downward-sloping RSI.
Long-term Sentiment (weeks to months): Neutral
While the asset remains significantly above 2022 cycle lows, the formation of a lower high versus the all-time high and a deep 50% retracement suggest a stalled secular trend.
Report Metadata
- Timeframe: monthly
- Generated at: 2026-02-02T07:19:37.110Z
- Model: gemini-3-pro-preview
Support Price Levels
| Level | Range | Strength | Notes |
|---|---|---|---|
| $99.08 | $95.00 - $103.16 | Strong | Immediate support zone defined by the 50-month SMA (103.16) and psychological $100 level. |
| $80.00 | $75.00 - $85.00 | Strong | Structural breakout zone and consolidation top from late 2023. |
| $27.50 | $25.00 - $30.00 | Strong | Major base formation level from the 2023 accumulation phase. |
Resistance Price Levels
| Level | Range | Strength | Notes |
|---|---|---|---|
| $163.50 | $162.00 - $165.00 | Strong | Coincides with the 20-month SMA (Bollinger Band basis) which previously acted as dynamic support. |
| $205.00 | $200.00 - $210.00 | Strong | Recent local high formed in early 2024. |
| $255.00 | $250.00 - $260.00 | Strong | Historical all-time high zone from 2021. |
Potential Chart Patterns in Formation
| Strength | Pattern | Signal | Target | Details |
|---|---|---|---|---|
| Strong | Parabolic Retracement | Bearish | N/A | After a vertical ascent from late 2023, price is undergoing a deep mean reversion typical of parabolic moves. |
| Weak | Potential Cup and Handle | Bullish | $260.00 | The multi-year recovery resembles a large cup; the current pullback could theoretically form a deep handle if support holds. |
Frequently Asked Questions about SOL
What is the current sentiment for SOL?
The short-term sentiment for SOL is currently Bearish because Price has lost the 20-month SMA and is piercing the 50-month SMA, confirmed by a bearish MACD crossover and downward-sloping RSI.. The long-term trend is classified as Neutral.
What are the key support levels for SOL?
StockDips.AI has identified key support levels for SOL at $99.08 and $80.00. These levels may represent potential accumulation zones where buying interest could emerge.
Is SOL in a significant dip or a Value Dip right now?
SOL has a Value Score of 66/100. It is not currently flagged as a significant dip in the Top Dips list. It is not listed as a Value Dip because the long-term sentiment or value-score threshold does not qualify.
View the full interactive analysis on StockDips.AI.