TRX Weekly Technical Analysis
Tron
TRON (TRX) is a decentralized blockchain platform for content sharing and dApps, aiming to create a free digital entertainment ecosystem; TRX is its native utility token used for transactions, governance (staking/voting), and powering the network, known for high throughput and low fees.
TRX Technical Analysis Summary
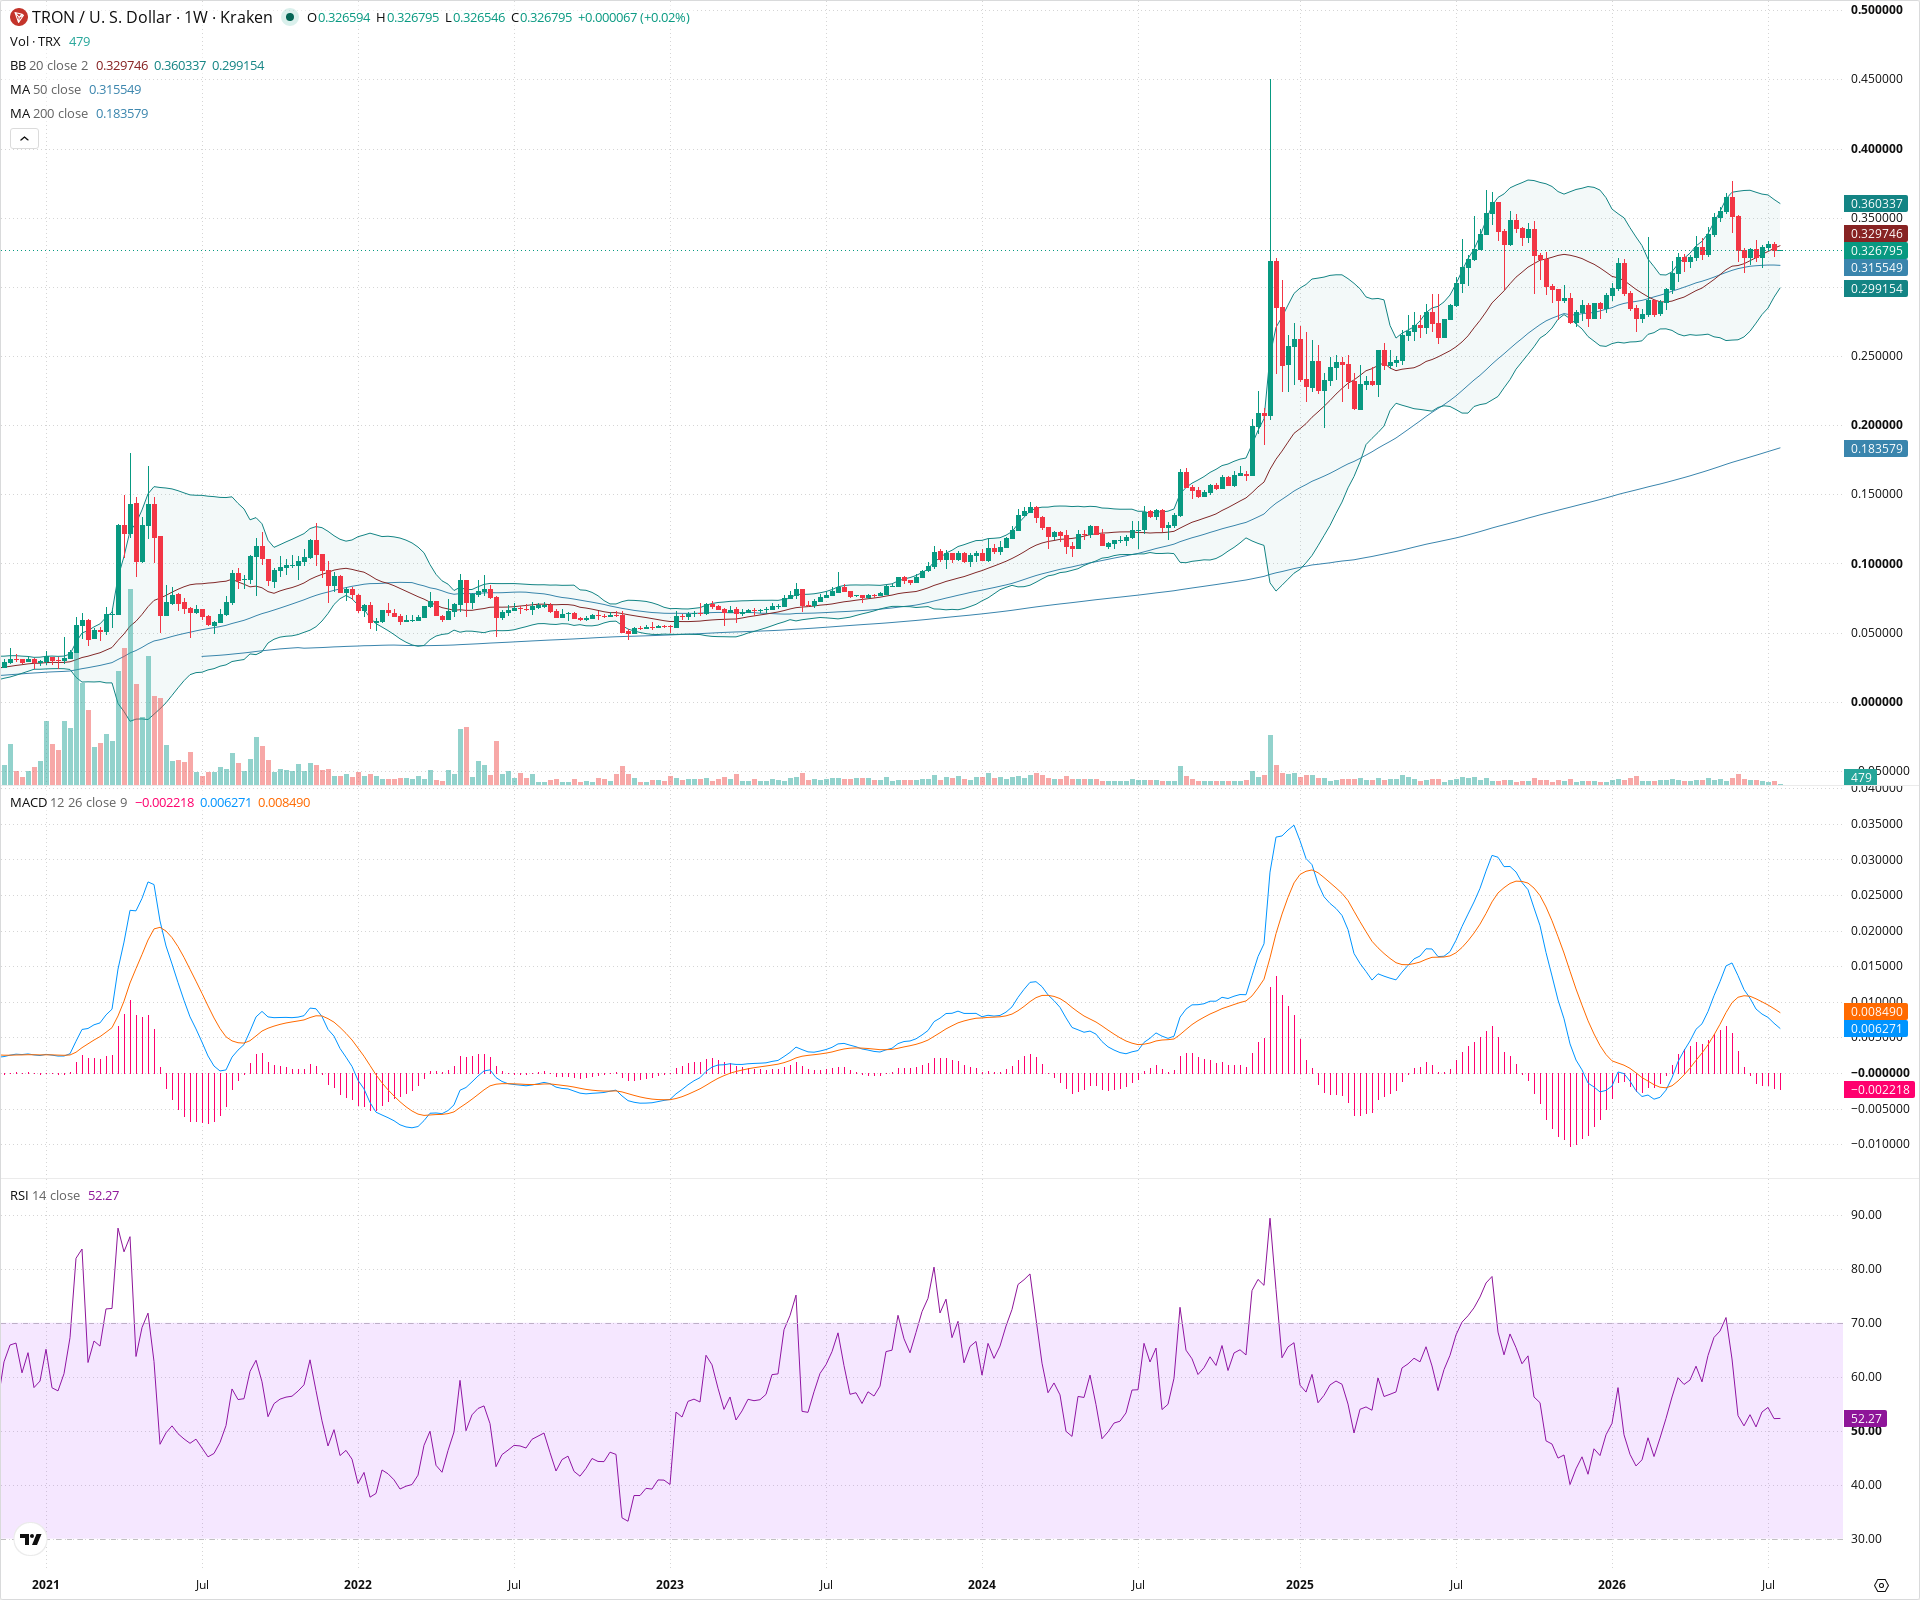
TRX experienced a massive parabolic breakout followed by a sharp correction, creating significant volatility. Despite cooling short-term momentum as evidenced by a falling RSI and a bearish MACD crossover, the long-term uptrend remains firmly intact. The price continues to hold critical support near the rising 50-week SMA, suggesting a period of healthy consolidation before determining the next major directional move.
Included In Lists
Related Tickers of Interest
TRX Weekly Chart
Sentiment
Short-term Sentiment (days to weeks): Neutral
Price is consolidating after a sharp pullback from a parabolic spike. Momentum indicators like the MACD are showing a bearish crossover with a negative histogram, and RSI has cooled to near 50, indicating fading short-term upward momentum.
Long-term Sentiment (weeks to months): Bullish
The long-term market structure remains firmly intact with the price holding above a rising 50-week SMA, which itself is well above the rising 200-week SMA. The broader trend remains up despite recent volatility.
Report Metadata
- Timeframe: weekly
- Generated at: 2026-07-20T00:03:00.828Z
- Model: gemini-3.1-pro-preview
Support Price Levels
| Level | Range | Strength | Notes |
|---|---|---|---|
| $0.30 | $0.29 - $0.32 | Strong | Current consolidation zone aligning with the rising 50-week SMA. |
| $0.24 | $0.23 - $0.25 | Strong | Previous multi-month resistance turned support shelf before the parabolic breakout. |
| $0.19 | $0.18 - $0.19 | Strong | Historical support area and approximate current location of the 200-week SMA. |
Resistance Price Levels
| Level | Range | Strength | Notes |
|---|---|---|---|
| $0.36 | $0.35 - $0.37 | Weak | Recent lower highs forming during the current consolidation phase. |
| $0.45 | $0.44 - $0.46 | Strong | The extreme high of the massive parabolic spike wick. |
Potential Chart Patterns in Formation
| Strength | Pattern | Signal | Target | Details |
|---|---|---|---|---|
| Strong | Parabolic Breakout and Correction | Neutral | N/A | A massive, high-volume upside expansion followed by a sharp rejection and subsequent multi-week consolidation. Price is attempting to build a new base at higher levels. |
Frequently Asked Questions about TRX
What is the current sentiment for TRX?
The short-term sentiment for TRX is currently Neutral because Price is consolidating after a sharp pullback from a parabolic spike. Momentum indicators like the MACD are showing a bearish crossover with a negative histogram, and RSI has cooled to near 50, indicating fading short-term upward momentum.. The long-term trend is classified as Bullish.
What are the key support levels for TRX?
StockDips.AI has identified key support levels for TRX at $0.30 and $0.24. These levels may represent potential accumulation zones where buying interest could emerge.
Is TRX in a significant dip or a Value Dip right now?
TRX has a Value Score of 87/100. It is currently flagged as a significant dip in the Top Dips list. It is also listed as a Value Dip because long-term sentiment is bullish.
View the full interactive analysis on StockDips.AI.