TRX Monthly Technical Analysis
Tron
TRON (TRX) is a decentralized blockchain platform for content sharing and dApps, aiming to create a free digital entertainment ecosystem; TRX is its native utility token used for transactions, governance (staking/voting), and powering the network, known for high throughput and low fees.
TRX Technical Analysis Summary
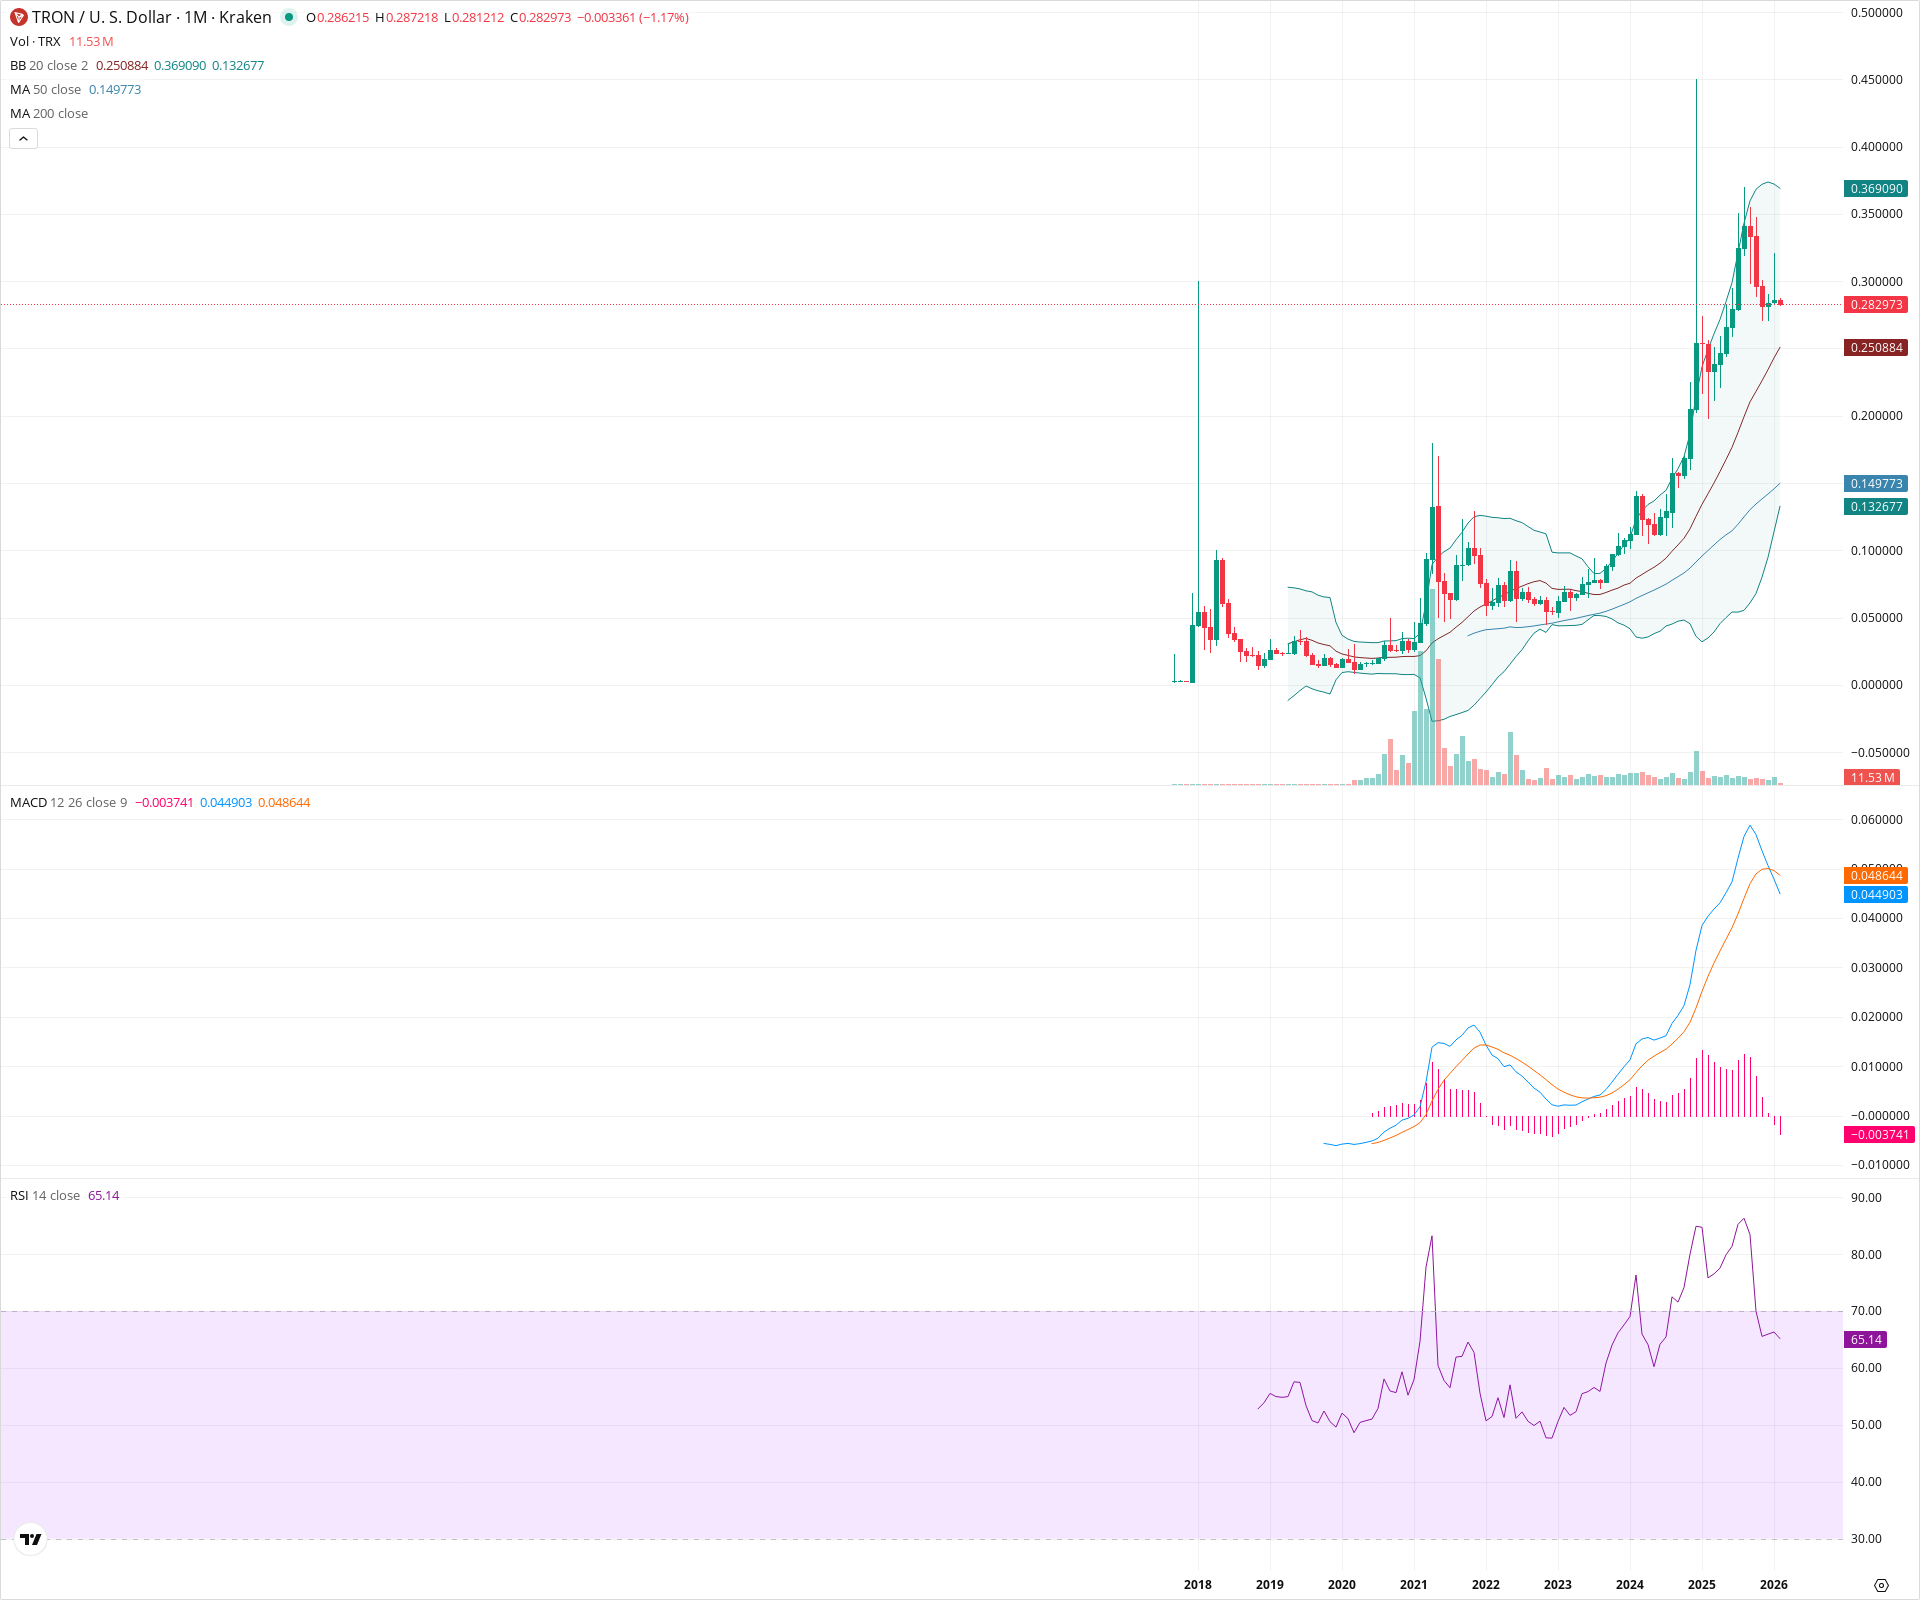
TRX has established a strong secular uptrend after exiting a multi-year accumulation phase. While the long-term structure is decisively bullish with price holding above the 20-month and 50-month SMAs, short-term momentum is waning as indicated by the negative monthly MACD histogram and recent price rejection near 0.45. The market is likely entering a period of consolidation or mean reversion towards the 0.25 support zone before deciding on trend continuation.
Included In Lists
Related Tickers of Interest
TRX Monthly Chart
Sentiment
Short-term Sentiment (days to weeks): Neutral
Price is consolidating after a parabolic advance, evidenced by the monthly MACD histogram turning negative and a bearish crossover of the MACD lines. The current candle shows a pullback, though structure remains constructive above immediate dynamic support.
Long-term Sentiment (weeks to months): Bullish
The asset is in a clear secular bull regime, trading well above the rising 50-month SMA and having successfully broken out of a multi-year base (2018-2023). The 20-month SMA is acting as trend support.
Report Metadata
- Timeframe: monthly
- Generated at: 2026-02-02T07:20:12.566Z
- Model: gemini-3-pro-preview
Support Price Levels
| Level | Range | Strength | Notes |
|---|---|---|---|
| $0.25 | $0.25 - $0.25 | Strong | Confluence of the 20-month SMA (Middle Bollinger Band) and recent consolidation lows. |
| $0.18 | $0.17 - $0.18 | Strong | Major multi-year structural breakout level (former 2021 resistance highs). |
| $0.15 | $0.15 - $0.15 | Strong | 50-month SMA level. |
Resistance Price Levels
| Level | Range | Strength | Notes |
|---|---|---|---|
| $0.37 | $0.36 - $0.37 | Weak | Upper Bollinger Band which previously capped the parabolic move. |
| $0.45 | $0.44 - $0.45 | Strong | Recent swing high wicks representing the local top of the current trend. |
Potential Chart Patterns in Formation
| Strength | Pattern | Signal | Target | Details |
|---|---|---|---|---|
| Strong | Secular Breakout / Rounding Bottom | Bullish | N/A | A massive 5-year base formation spanning from 2018 to 2023, which resolved in a high-volume breakout above the 0.18 level. |
Frequently Asked Questions about TRX
What is the current sentiment for TRX?
The short-term sentiment for TRX is currently Neutral because Price is consolidating after a parabolic advance, evidenced by the monthly MACD histogram turning negative and a bearish crossover of the MACD lines. The current candle shows a pullback, though structure remains constructive above immediate dynamic support.. The long-term trend is classified as Bullish.
What are the key support levels for TRX?
StockDips.AI has identified key support levels for TRX at $0.25 and $0.18. These levels may represent potential accumulation zones where buying interest could emerge.
Is TRX in a significant dip or a Value Dip right now?
TRX has a Value Score of 98/100. It is currently flagged as a significant dip in the Top Dips list. It is also listed as a Value Dip because long-term sentiment is bullish.
View the full interactive analysis on StockDips.AI.