V Monthly Technical Analysis
Visa
World’s leading digital payments network enabling global card transactions.
V Technical Analysis Summary
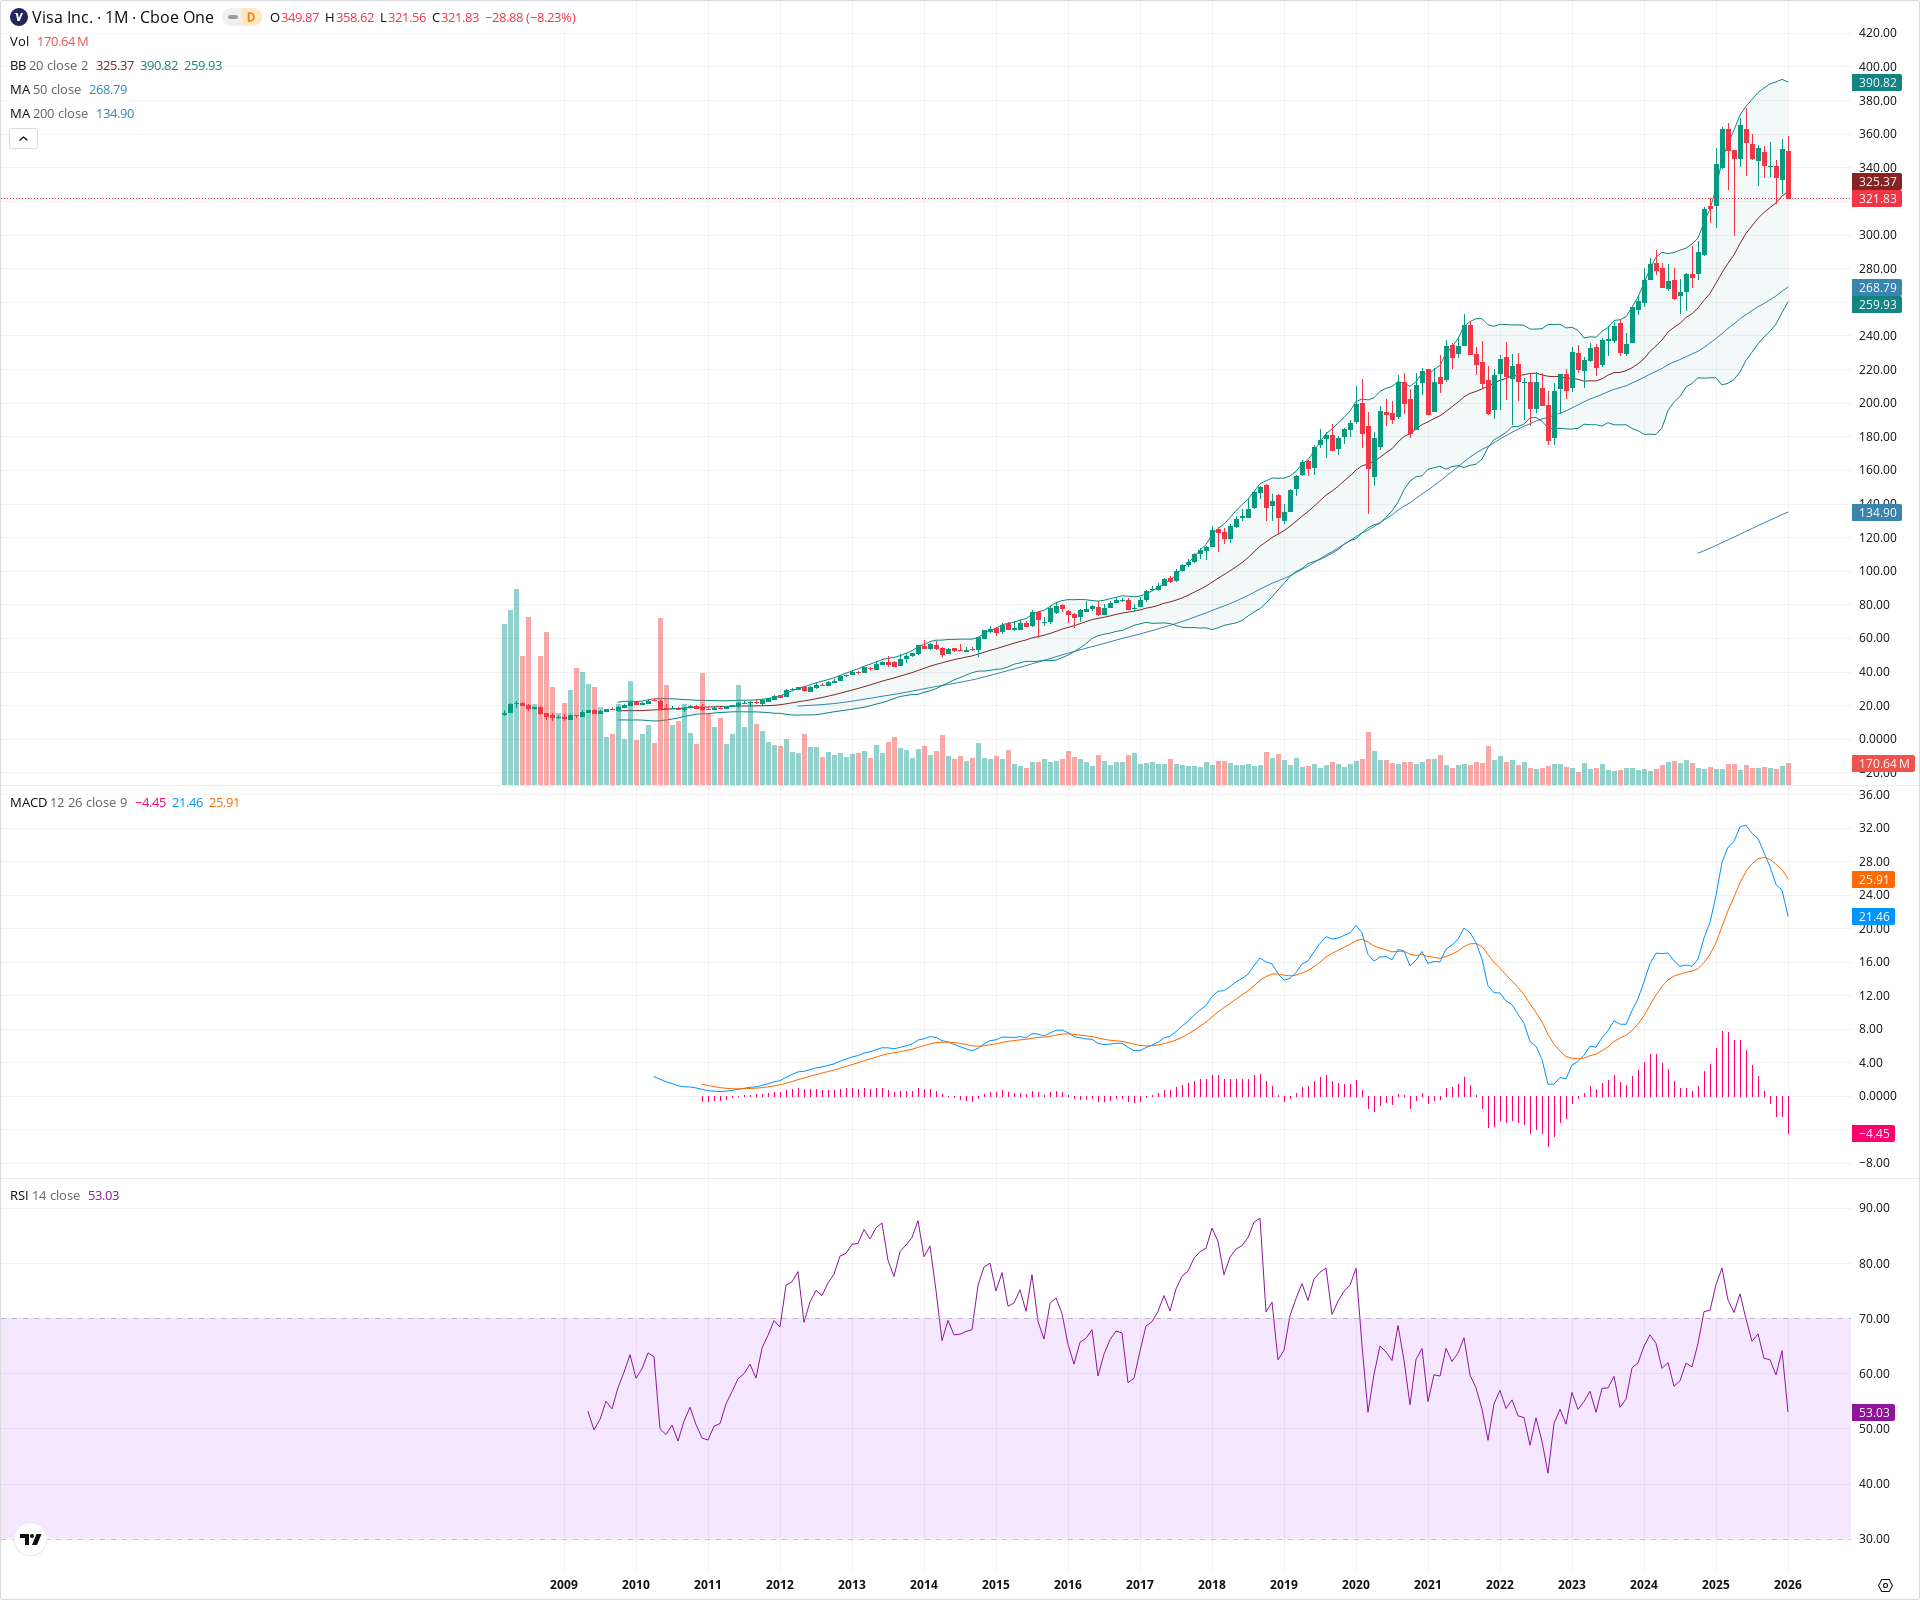
Visa remains in a powerful secular uptrend, with the long-term structure firmly supported by rising 50-month and 200-month moving averages. However, immediate price action signals a deepening correction, evidenced by a bearish MACD crossover and a loss of the 20-month SMA, suggesting a potential retest of the 270–290 support zone before the primary uptrend resumes.
Included In Lists
Related Tickers of Interest
V Monthly Chart
Sentiment
Short-term Sentiment (days to weeks): Bearish
The current monthly candle is a large red marubozu-style bar representing a sharp >8% decline, engulfing the prior month's price action. Price has closed below the 20-period SMA, and the MACD has executed a bearish crossover at a high level, indicating a distinct shift in medium-term momentum.
Long-term Sentiment (weeks to months): Bullish
The primary secular trend remains strongly upward, evidenced by the perfect alignment of the 50-month and 200-month SMAs which are both rising. The current pullback appears to be a correction within a long-term bull market, as price remains significantly above major structural support zones and the rising 50-month SMA.
Report Metadata
- Timeframe: monthly
- Generated at: 2026-02-02T06:59:55.292Z
- Model: gemini-3-pro-preview
Support Price Levels
| Level | Range | Strength | Notes |
|---|---|---|---|
| $290.00 | $285.00 - $295.00 | Weak | Minor support area derived from consolidation prior to the most recent leg up. |
| $265.00 | $260.00 - $270.00 | Strong | Confluence of the rising 50-month SMA and the major breakout level from the 2021-2022 consolidation range. |
| $252.50 | $250.00 - $255.00 | Strong | Historical resistance turned support; top of the multi-year base formed in 2021-2022. |
Resistance Price Levels
| Level | Range | Strength | Notes |
|---|---|---|---|
| $327.50 | $325.00 - $330.00 | Weak | Immediate resistance at the 20-month SMA which price has just closed below. |
| $359.00 | $358.00 - $360.00 | Strong | All-time high area established by the recent peak. |
Potential Chart Patterns in Formation
| Strength | Pattern | Signal | Target | Details |
|---|---|---|---|---|
| Strong | Secular Uptrend | Bullish | N/A | A well-defined multi-decade channel of higher highs and higher lows, supported by the 200-month SMA. |
| Weak | Corrective Pullback | Bearish | $270.00 | Sharp reversion from the upper Bollinger Band towards the mean, accompanied by a MACD bearish cross. |
Frequently Asked Questions about V
What is the current sentiment for V?
The short-term sentiment for V is currently Bearish because The current monthly candle is a large red marubozu-style bar representing a sharp >8% decline, engulfing the prior month's price action. Price has closed below the 20-period SMA, and the MACD has executed a bearish crossover at a high level, indicating a distinct shift in medium-term momentum.. The long-term trend is classified as Bullish.
What are the key support levels for V?
StockDips.AI has identified key support levels for V at $290.00 and $265.00. These levels may represent potential accumulation zones where buying interest could emerge.
Is V in a significant dip or a Value Dip right now?
V has a Value Score of 62/100. It is not currently flagged as a significant dip in the Top Dips list. It is not listed as a Value Dip because the long-term sentiment or value-score threshold does not qualify.
View the full interactive analysis on StockDips.AI.