XRP Weekly Technical Analysis
XRP
Designed for fast and low-cost cross-border payments and remittances.
XRP Technical Analysis Summary
XRP is firmly entrenched in a long-term bearish trend on the weekly timeframe, characterized by lower highs and positioning below key moving averages. The price is currently testing a critical make-or-break support zone near $1.00. A decisive breakdown below this level could lead to significant further downside, while a successful defense might prompt a short-term reversion toward the 20-week SMA.
Included In Lists
Related Tickers of Interest
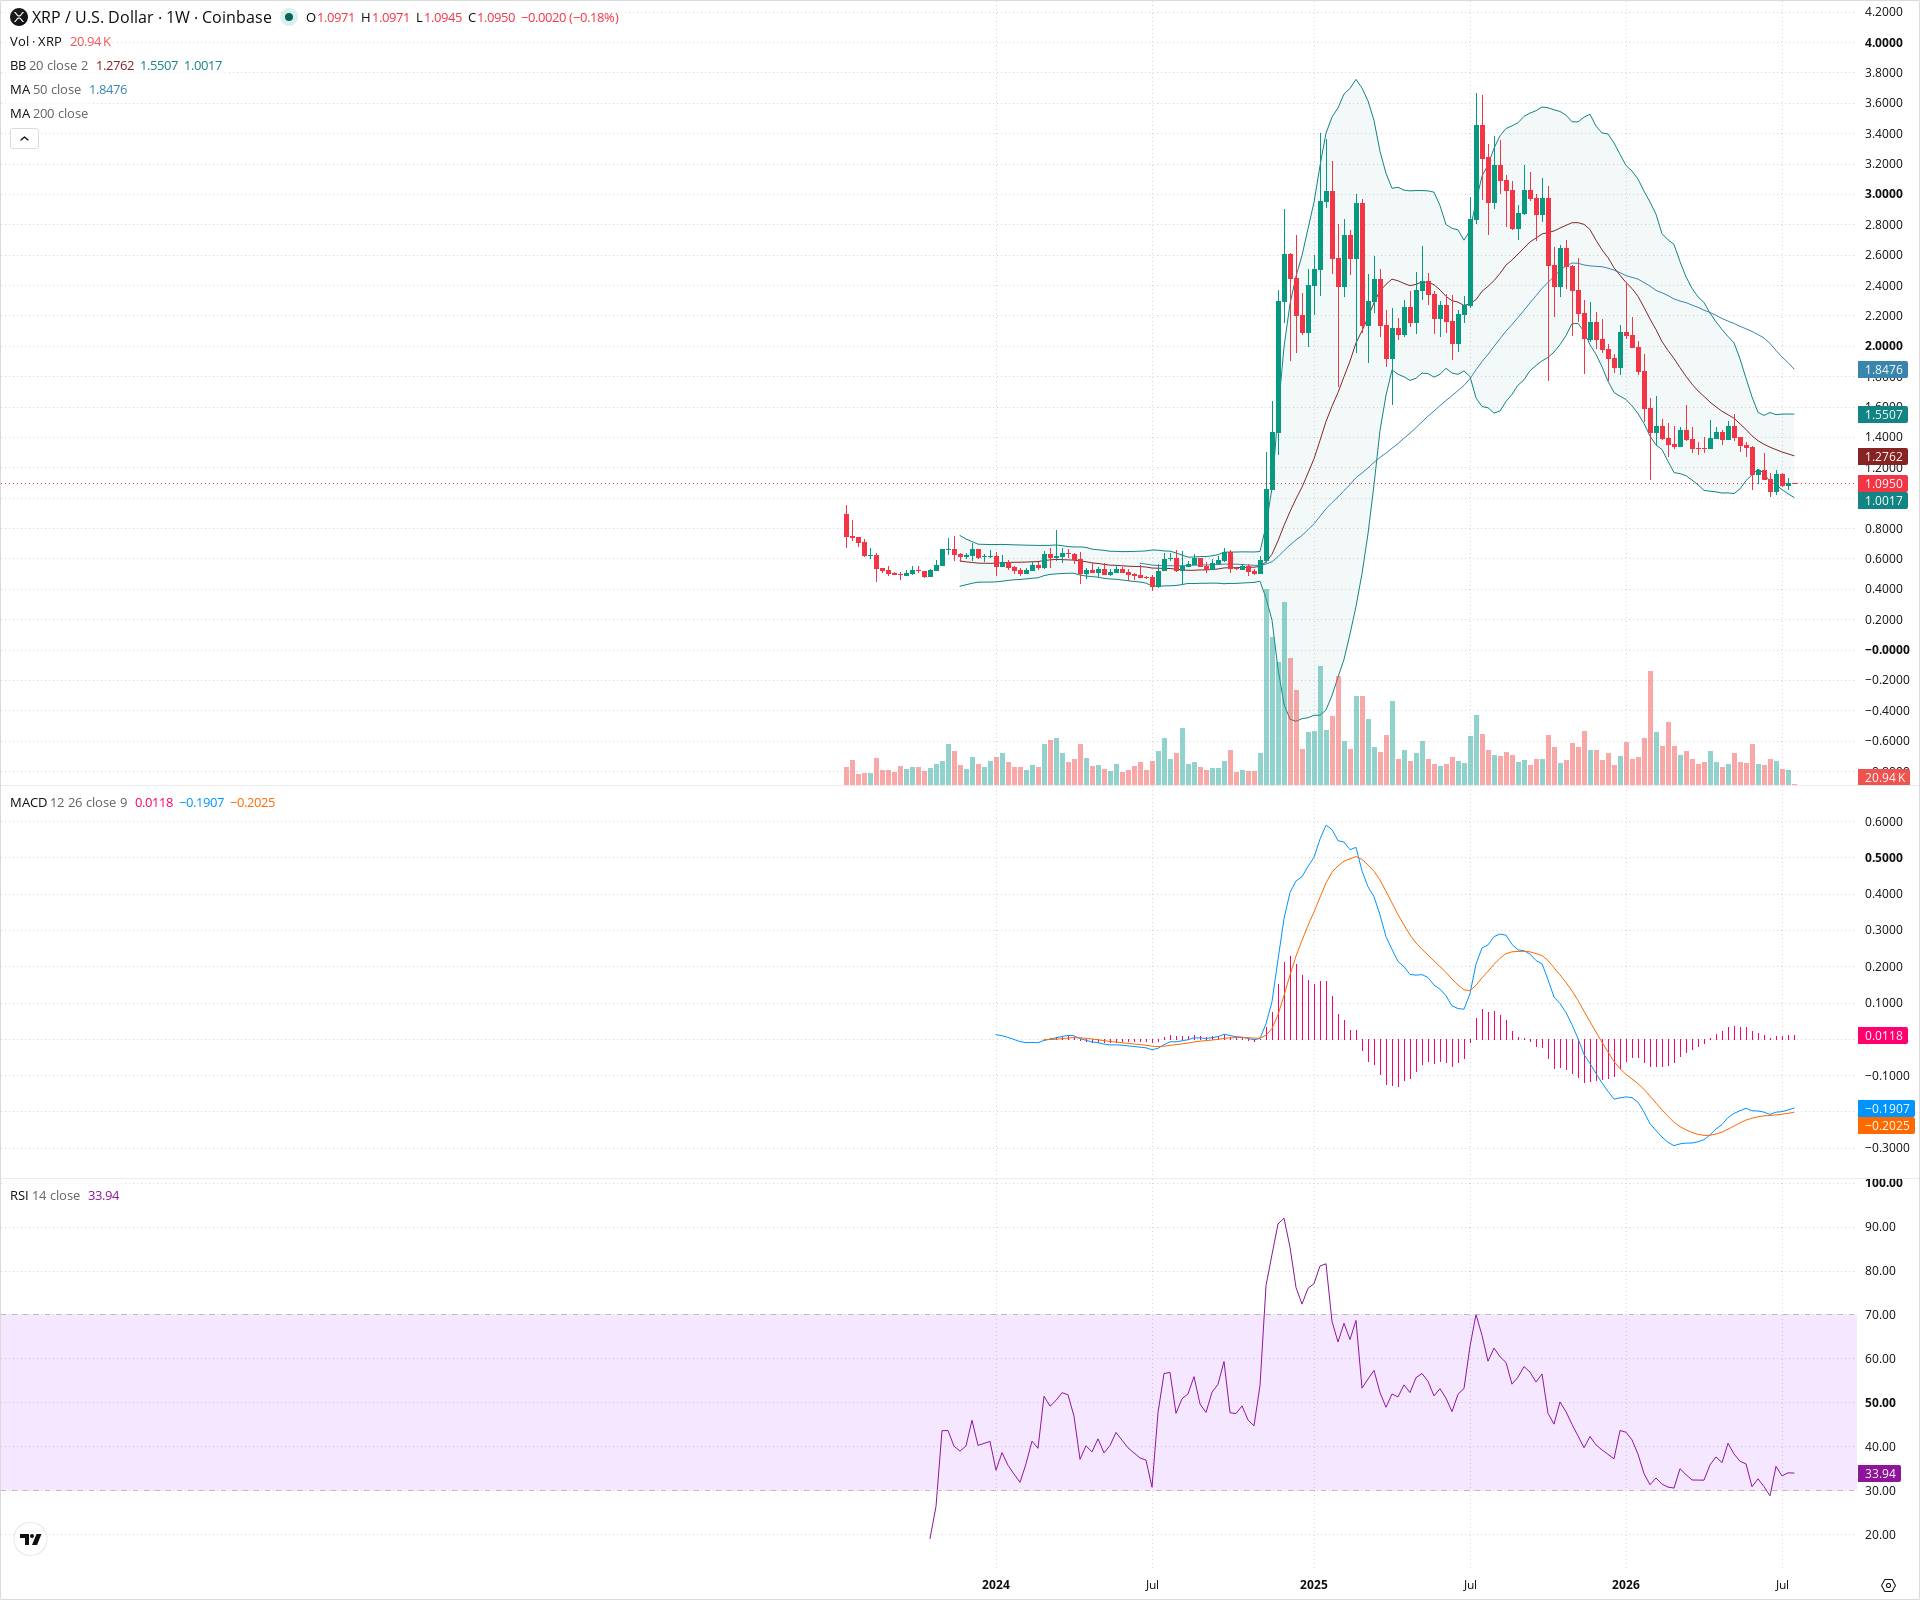
XRP Weekly Chart
Sentiment
Short-term Sentiment (days to weeks): Bearish
Price remains in a downward structure, trading below the 20-week SMA with RSI nearing oversold levels, indicating continued near-term selling pressure.
Long-term Sentiment (weeks to months): Bearish
The chart displays a sustained multi-year sequence of lower highs and lower lows. Price is significantly below the declining 50-week SMA, and the MACD remains deep in negative territory.
Report Metadata
- Timeframe: weekly
- Generated at: 2026-07-20T00:02:53.728Z
- Model: gemini-3.1-pro-preview
Support Price Levels
| Level | Range | Strength | Notes |
|---|---|---|---|
| $1.00 | $0.95 - $1.05 | Strong | Major psychological round number, recent swing lows, and confluence with the lower Bollinger Band. |
| $0.50 | $0.40 - $0.60 | Strong | Historical base and massive consolidation zone prior to the previous major bull run. |
Resistance Price Levels
| Level | Range | Strength | Notes |
|---|---|---|---|
| $1.30 | $1.25 - $1.35 | Weak | Immediate resistance at the 20-week SMA (middle Bollinger Band). |
| $1.90 | $1.80 - $2.00 | Strong | Previous structural breakdown level and confluence with the descending 50-week SMA. |
Potential Chart Patterns in Formation
| Strength | Pattern | Signal | Target | Details |
|---|---|---|---|---|
| Strong | Descending Triangle | Bearish | N/A | Price is forming a sequence of lower highs while repeatedly testing horizontal support near the $1.00 level, indicating bearish compression. |
Frequently Asked Questions about XRP
What is the current sentiment for XRP?
The short-term sentiment for XRP is currently Bearish because Price remains in a downward structure, trading below the 20-week SMA with RSI nearing oversold levels, indicating continued near-term selling pressure.. The long-term trend is classified as Bearish.
What are the key support levels for XRP?
StockDips.AI has identified key support levels for XRP at $1.00 and $0.50. These levels may represent potential accumulation zones where buying interest could emerge.
Is XRP in a significant dip or a Value Dip right now?
XRP has a Value Score of 57/100. It is not currently flagged as a significant dip in the Top Dips list. It is not listed as a Value Dip because the long-term sentiment or value-score threshold does not qualify.
View the full interactive analysis on StockDips.AI.