XRP Monthly Technical Analysis
XRP
Designed for fast and low-cost cross-border payments and remittances.
XRP Technical Analysis Summary
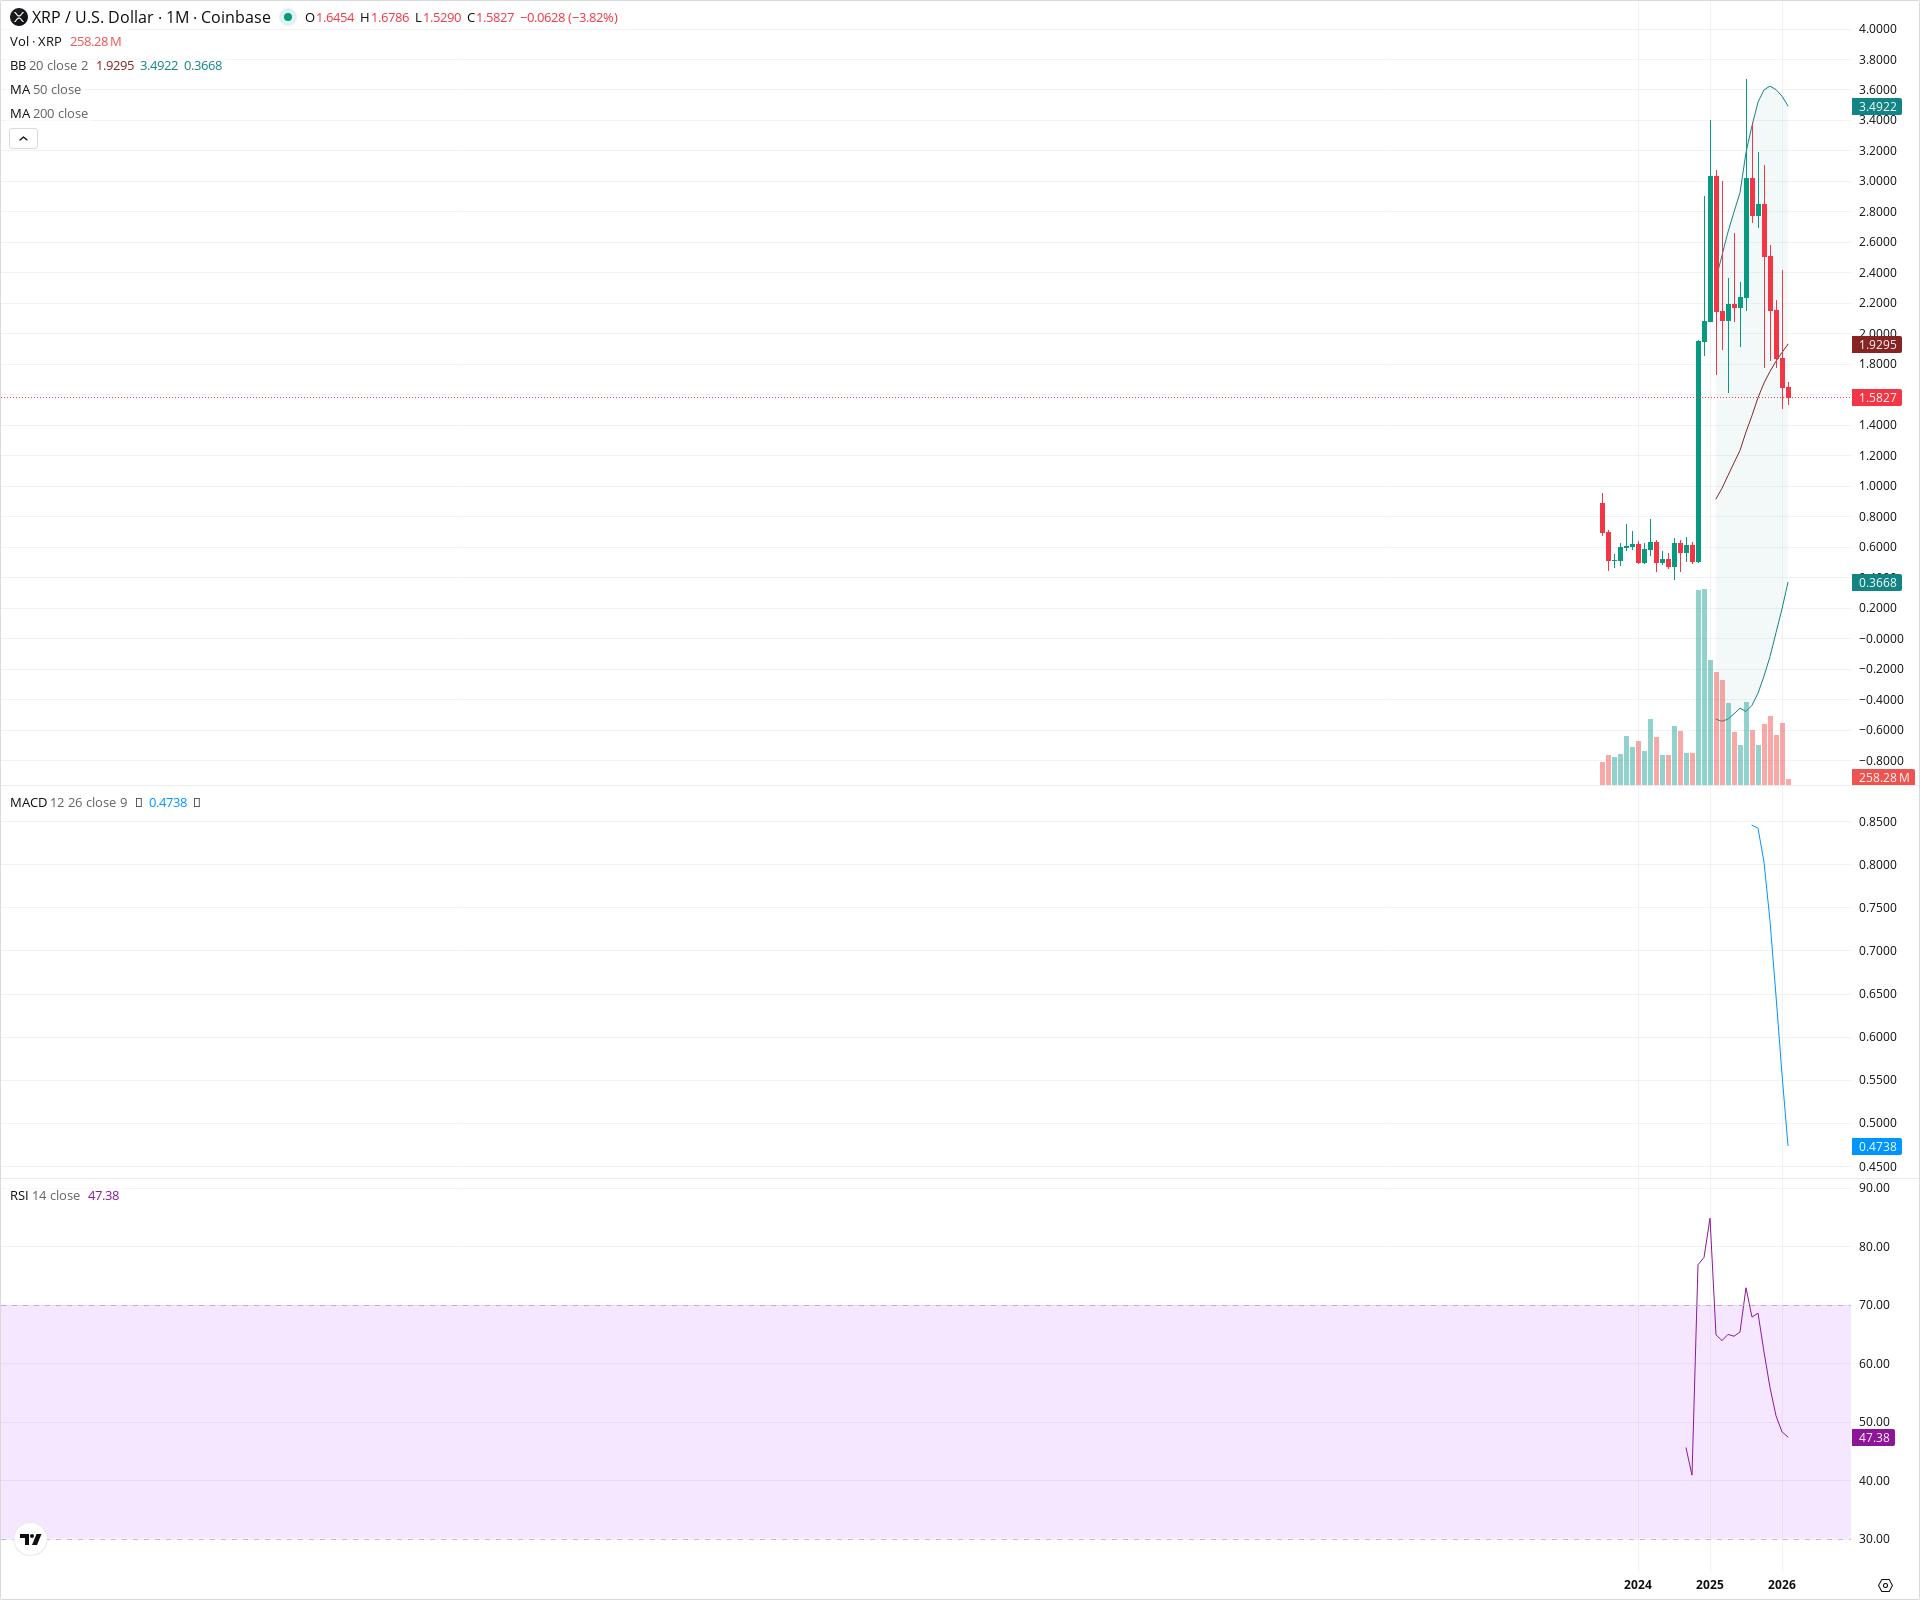
XRP has experienced a classic boom-bust cycle on the monthly timeframe, rallying vertically to ~3.50 before crashing below the 20-month SMA (~1.93). Technical indicators have deteriorated significantly, with the RSI dropping from overbought levels to below 50, signaling a complete loss of bullish momentum. The market is currently in a deep correction phase, searching for structural support likely in the 0.90–1.00 region if current levels fail to hold.
Included In Lists
Related Tickers of Interest
XRP Monthly Chart
Sentiment
Short-term Sentiment (days to weeks): Bearish
Price has collapsed rapidly from highs of ~3.50 to 1.58, falling below the 20-month SMA (1.93) with strong downward momentum.
Long-term Sentiment (weeks to months): Neutral
While the secular trend from the 0.60 base remains technically intact, the violent rejection and loss of the 20-month moving average jeopardize the bullish regime.
Report Metadata
- Timeframe: monthly
- Generated at: 2026-02-02T07:20:12.465Z
- Model: gemini-3-pro-preview
Support Price Levels
| Level | Range | Strength | Notes |
|---|---|---|---|
| $1.52 | $1.50 - $1.53 | Weak | Current monthly low and immediate pivot area. |
| $0.93 | $0.85 - $1.00 | Strong | Major breakout zone from the multi-year consolidation phase. |
| $0.60 | $0.55 - $0.65 | Strong | The secular base floor established over 2024-2025. |
Resistance Price Levels
| Level | Range | Strength | Notes |
|---|---|---|---|
| $1.92 | $1.90 - $1.95 | Strong | Confluence of the 20-month SMA (Bollinger Basis) and previous price structure. |
| $2.65 | $2.50 - $2.80 | Weak | Mid-point of the recent breakdown candle. |
| $3.55 | $3.50 - $3.60 | Strong | All-time high of the current cycle (Blow-off top peak). |
Potential Chart Patterns in Formation
| Strength | Pattern | Signal | Target | Details |
|---|---|---|---|---|
| Strong | Blow-off Top | Bearish | $0.90 | Vertical parabolic ascent followed by an immediate, sharp retracement of >50%. |
Frequently Asked Questions about XRP
What is the current sentiment for XRP?
The short-term sentiment for XRP is currently Bearish because Price has collapsed rapidly from highs of ~3.50 to 1.58, falling below the 20-month SMA (1.93) with strong downward momentum.. The long-term trend is classified as Neutral.
What are the key support levels for XRP?
StockDips.AI has identified key support levels for XRP at $1.52 and $0.93. These levels may represent potential accumulation zones where buying interest could emerge.
Is XRP in a significant dip or a Value Dip right now?
XRP has a Value Score of 50/100. It is not currently flagged as a significant dip in the Top Dips list. It is not listed as a Value Dip because the long-term sentiment or value-score threshold does not qualify.
View the full interactive analysis on StockDips.AI.