ZEC Weekly Technical Analysis
ZCash
Zcash (ZEC) is a privacy-focused cryptocurrency that enables optional anonymity for transactions by using advanced cryptography. While the Zcash protocol governs the network, ZEC is the native monetary unit, or coin, used for transactions.
ZEC Technical Analysis Summary
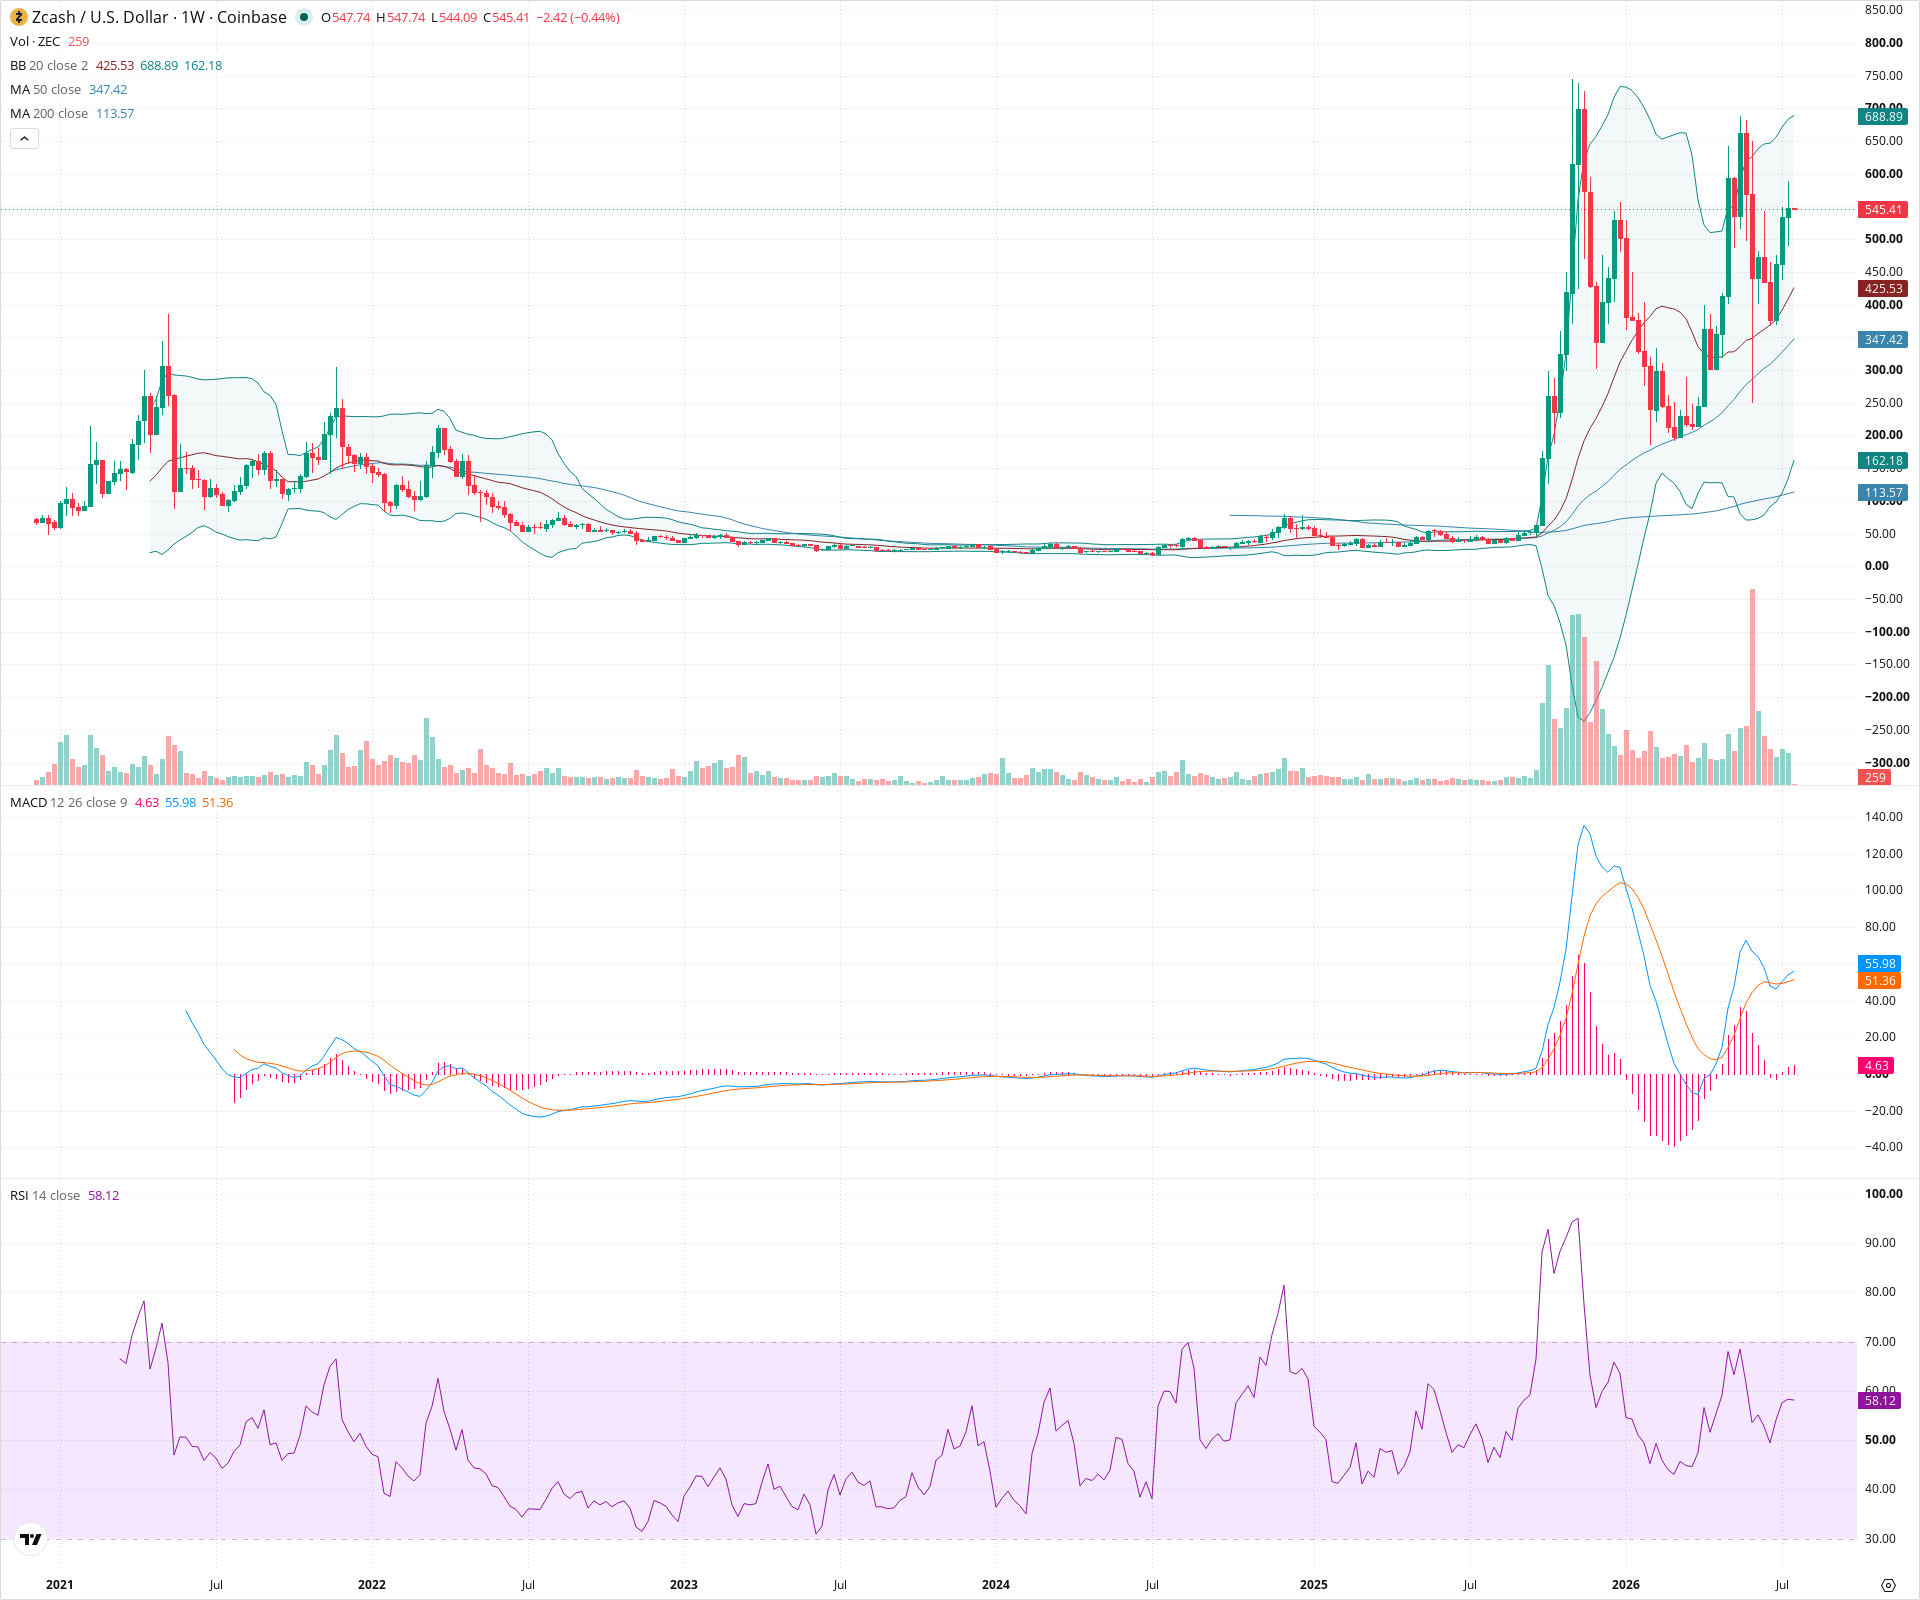
ZEC is in a strong long-term uptrend on the weekly timeframe, supported by bullish moving average alignment. Recently, the price has experienced a significant pullback from multi-year highs but appears to be consolidating above the rising 50-week SMA. The MACD histogram suggests downward momentum may be waning, and the RSI remains in bullish territory above 50, indicating potential for upward continuation if key support holds.
Included In Lists
Related Tickers of Interest
ZEC Weekly Chart
Sentiment
Short-term Sentiment (days to weeks): Neutral
Price is consolidating after a significant pullback from recent highs, finding support near the 50-week SMA while MACD shows a potential loss of downward momentum.
Long-term Sentiment (weeks to months): Bullish
The long-term trend remains upward, characterized by higher highs and higher lows, with the 50-week SMA trending above the 200-week SMA, and the current price holding above key long-term moving averages.
Report Metadata
- Timeframe: weekly
- Generated at: 2026-07-20T00:04:29.028Z
- Model: gemini-3.1-pro-preview
Support Price Levels
| Level | Range | Strength | Notes |
|---|---|---|---|
| $375.00 | $350.00 - $400.00 | Strong | Confluence of recent consolidation low and the rising 50-week SMA. |
| $175.00 | $150.00 - $200.00 | Strong | Major prior consolidation zone and historical support area. |
Resistance Price Levels
| Level | Range | Strength | Notes |
|---|---|---|---|
| $625.00 | $600.00 - $650.00 | Weak | Interim resistance level derived from recent swing highs before the pullback. |
| $775.00 | $750.00 - $800.00 | Strong | Recent multi-year high and significant psychological resistance area. |
Potential Chart Patterns in Formation
| Strength | Pattern | Signal | Target | Details |
|---|---|---|---|---|
| Strong | Ascending Triangle Formation | Bullish | N/A | Price is forming higher lows while testing a horizontal resistance zone near previous peaks, indicating potential accumulation. |
Frequently Asked Questions about ZEC
What is the current sentiment for ZEC?
The short-term sentiment for ZEC is currently Neutral because Price is consolidating after a significant pullback from recent highs, finding support near the 50-week SMA while MACD shows a potential loss of downward momentum.. The long-term trend is classified as Bullish.
What are the key support levels for ZEC?
StockDips.AI has identified key support levels for ZEC at $375.00 and $175.00. These levels may represent potential accumulation zones where buying interest could emerge.
Is ZEC in a significant dip or a Value Dip right now?
ZEC has a Value Score of 60/100. It is not currently flagged as a significant dip in the Top Dips list. It is not listed as a Value Dip because the long-term sentiment or value-score threshold does not qualify.
View the full interactive analysis on StockDips.AI.