ZEC Monthly Technical Analysis
ZCash
Zcash (ZEC) is a privacy-focused cryptocurrency that enables optional anonymity for transactions by using advanced cryptography. While the Zcash protocol governs the network, ZEC is the native monetary unit, or coin, used for transactions.
ZEC Technical Analysis Summary
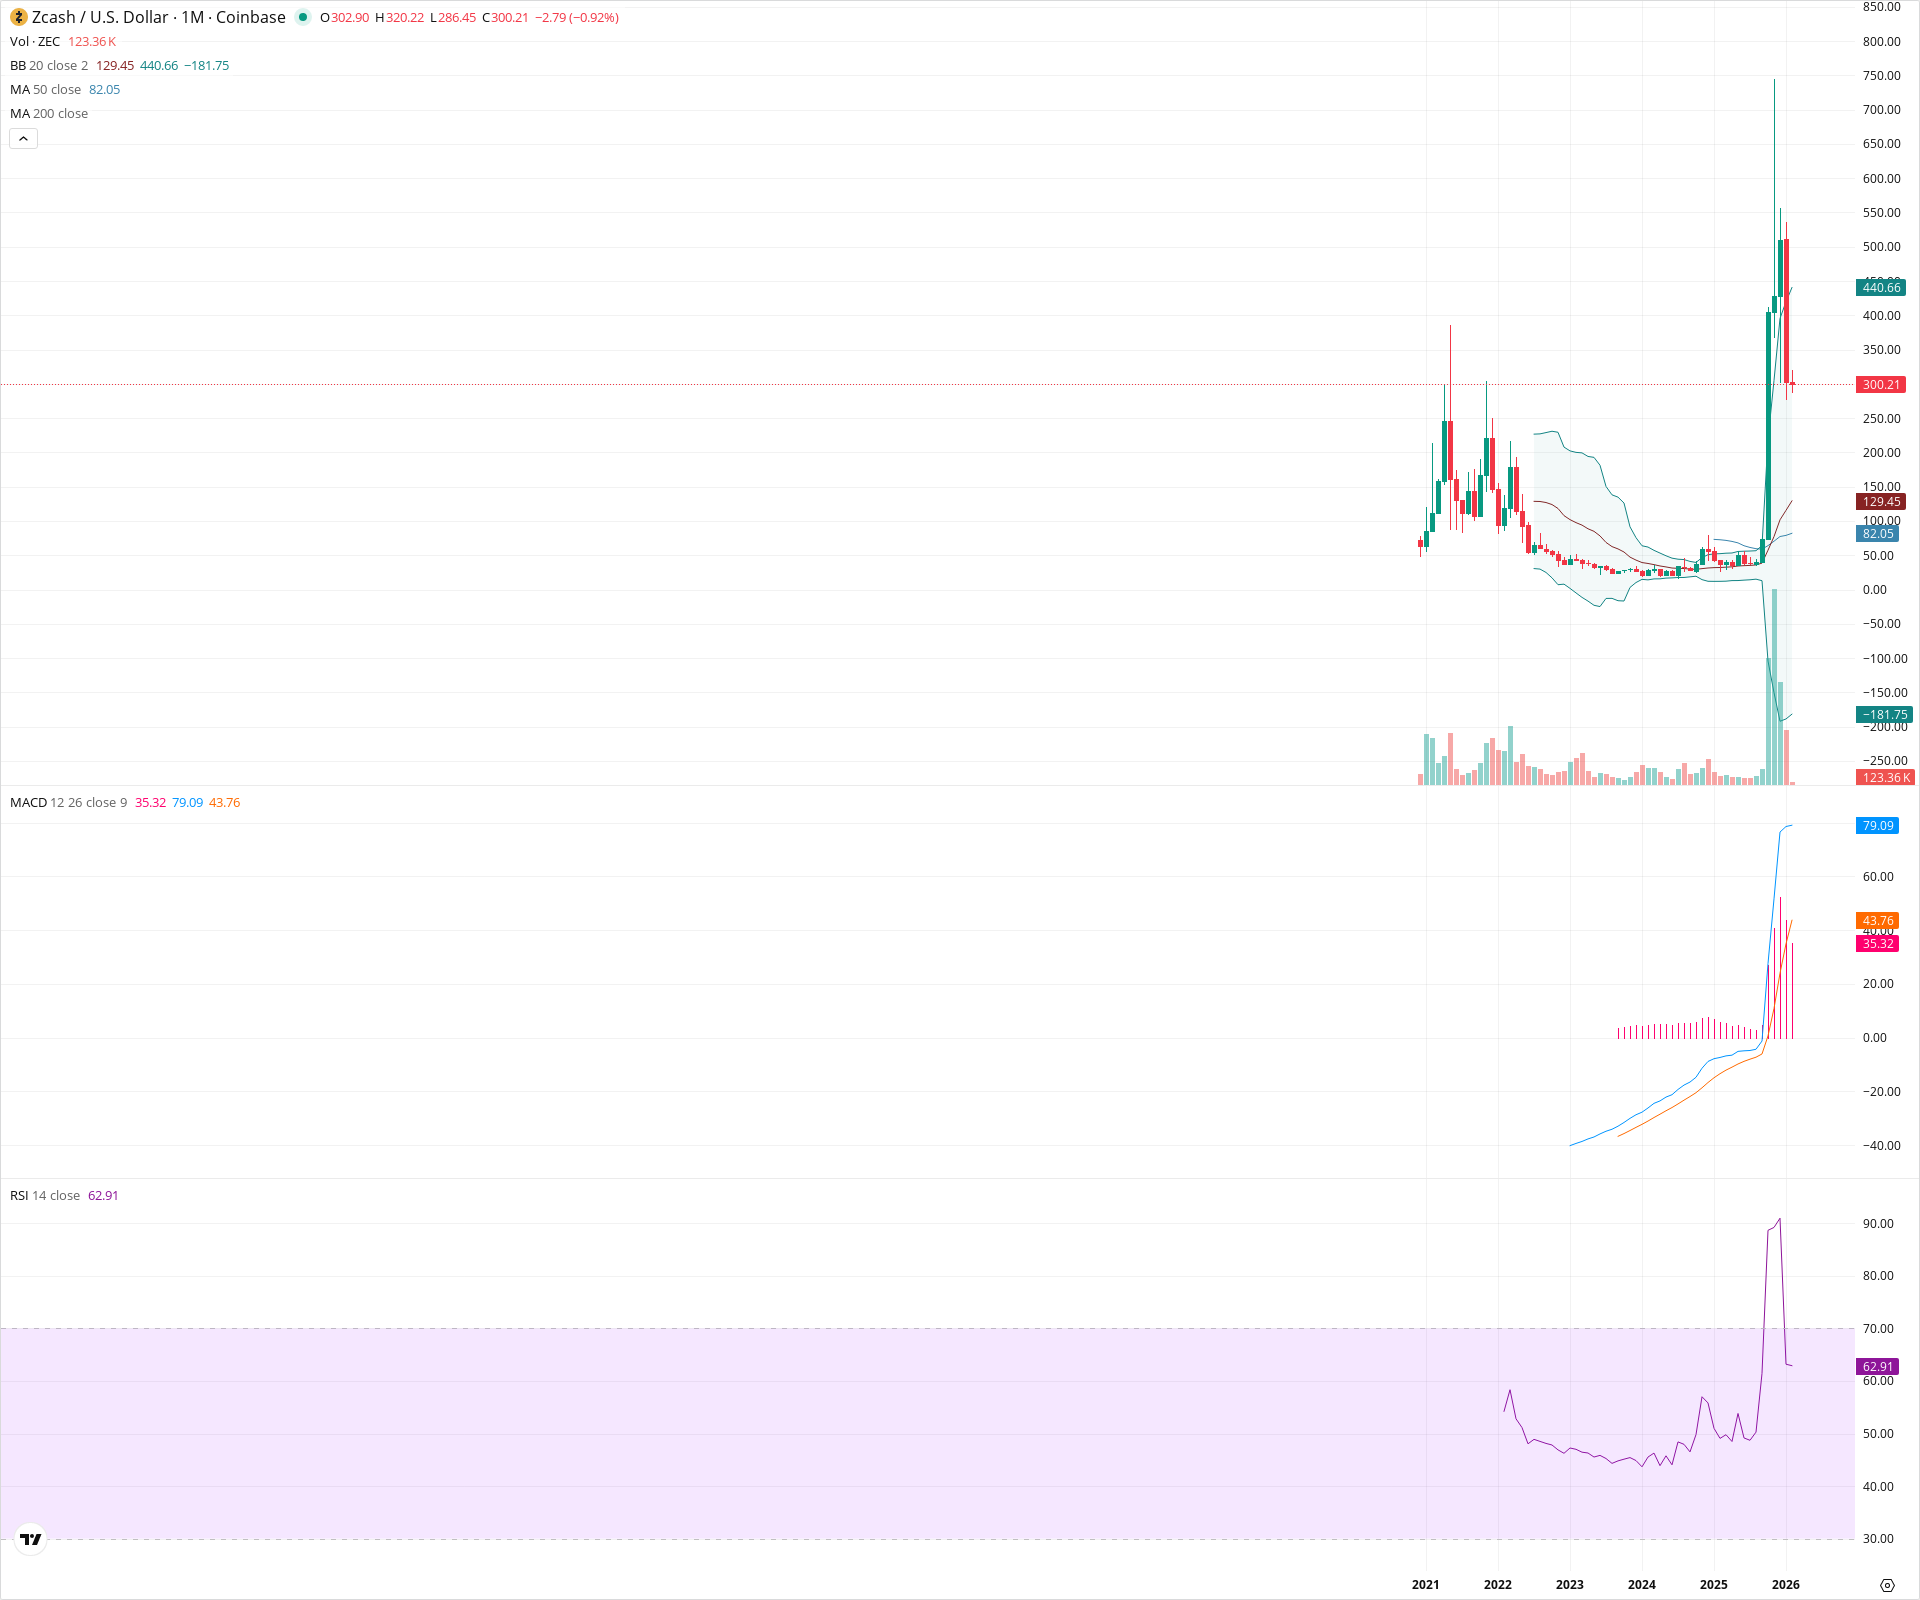
ZEC has executed a violent breakout from a 3-year accumulation phase, entering a new long-term bullish regime. While the move to ~760 was parabolic and unsustainable in the short term, resulting in a sharp mean reversion, the long-term structure remains constructive as long as price holds above the breakout zones. The current consolidation near 300 represents a critical test of previous cycle highs acting as support.
Included In Lists
Related Tickers of Interest
ZEC Monthly Chart
Sentiment
Short-term Sentiment (days to weeks): Neutral
The asset is experiencing extreme volatility following a massive parabolic spike to ~750. While the RSI has hooked down sharply from overbought levels, price is currently trying to stabilize around the 300 level, which coincides with previous structural resistance.
Long-term Sentiment (weeks to months): Bullish
Price has decisively broken out of a multi-year accumulation base (2022–2025). The 20 and 50-period SMAs are trending upwards, and the MACD is in a strong positive regime, confirming a secular trend reversal despite the recent pullback.
Report Metadata
- Timeframe: monthly
- Generated at: 2026-02-02T07:19:59.310Z
- Model: gemini-3-pro-preview
Support Price Levels
| Level | Range | Strength | Notes |
|---|---|---|---|
| $290.00 | $280.00 - $300.00 | Strong | Confluence of current price action and the major swing highs from 2021 (resistance turned support). |
| $125.00 | $120.00 - $130.00 | Strong | Aligns with the 20-month SMA and the top of the prior multi-year consolidation range. |
Resistance Price Levels
| Level | Range | Strength | Notes |
|---|---|---|---|
| $445.00 | $440.00 - $450.00 | Weak | Coincides with the current Upper Bollinger Band level. |
| $755.00 | $750.00 - $760.00 | Strong | Recent all-time high wick created during the parabolic blowout. |
Potential Chart Patterns in Formation
| Strength | Pattern | Signal | Target | Details |
|---|---|---|---|---|
| Strong | Multi-Year Base Breakout | Bullish | N/A | A prolonged rounding bottom/accumulation phase from 2022 to 2025 that resolved in a high-volume vertical expansion. |
Frequently Asked Questions about ZEC
What is the current sentiment for ZEC?
The short-term sentiment for ZEC is currently Neutral because The asset is experiencing extreme volatility following a massive parabolic spike to ~750. While the RSI has hooked down sharply from overbought levels, price is currently trying to stabilize around the 300 level, which coincides with previous structural resistance.. The long-term trend is classified as Bullish.
What are the key support levels for ZEC?
StockDips.AI has identified key support levels for ZEC at $290.00 and $125.00. These levels may represent potential accumulation zones where buying interest could emerge.
Is ZEC in a significant dip or a Value Dip right now?
ZEC has a Value Score of 60/100. It is not currently flagged as a significant dip in the Top Dips list. It is not listed as a Value Dip because the long-term sentiment or value-score threshold does not qualify.
View the full interactive analysis on StockDips.AI.